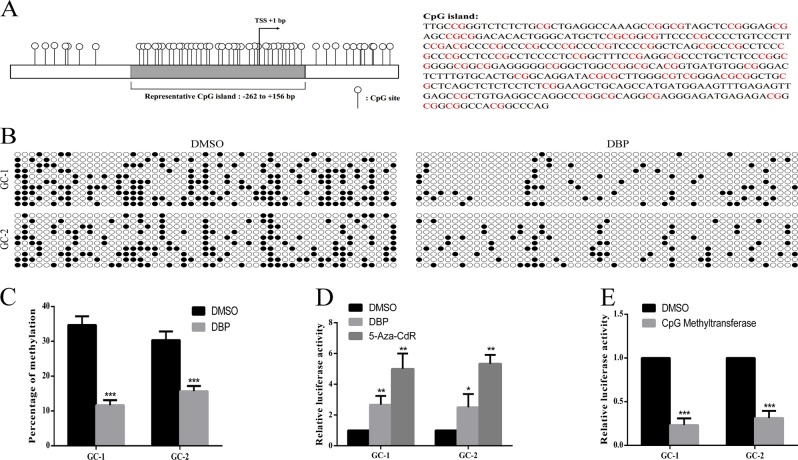
Fig. 5. DBP induces PTEN promoter demethylation and global decline in DNA methylation.
a The schematic diagram and sequence of representative CpG Island of the PTEN promoter region. b Representative bisulfite-sequencing PCR results for the CpG island in the PTEN promoter region in GC-1 and GC-2 cells. Each row represents the result of a clone sequence, each column represents a CpG site of the CpG island (10 clones, 53 CpG sites). The solid spots represent methylated CpG sites, the hollow spots represent unmethylated CpG sites. c–e Percentage of methylation for the CpG island above in GC-1 and GC-2 cells in the treatment of DBP, 5-Aza-CdR, or CpG Methyltransferase. All measurements are shown as the means ± SD from three independent experiments, **p < 0.05, ***p < 0.01, ****p < 0.001

