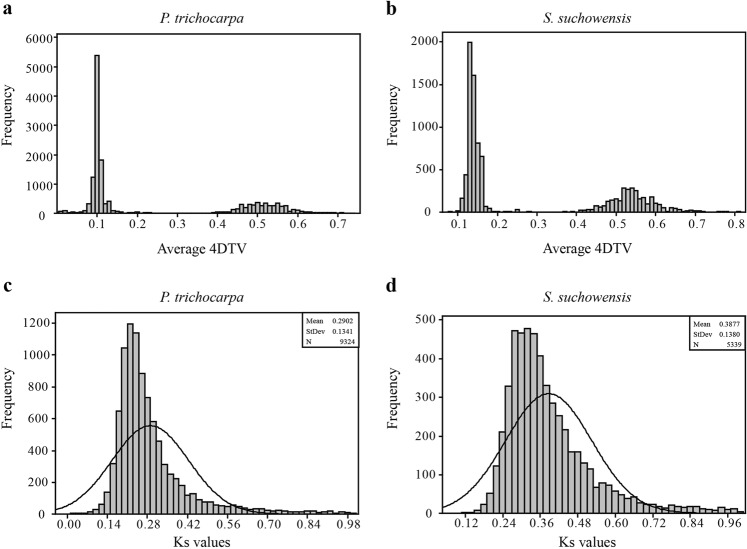
Fig. 1. Plotting the average 4DTV and Ks values for paralogous genes on the syntenic segments (PGSS) in the genome of P.
trichocarpa and S. suchowensis a Plotting the average 4DTV values for PGSS in the P. trichocarpa genome. b Plotting the average 4DTV values for PGSS in the S. suchowensis genome. c Plotting the Ks values for PGSS with 4DTV in the range of 0.050 to 0.150 in the P. trichocarpa genome. d Plotting the Ks values for PGSS with 4DTV in the range of 0.103 to 0.172 in the S. suchowensis genome

