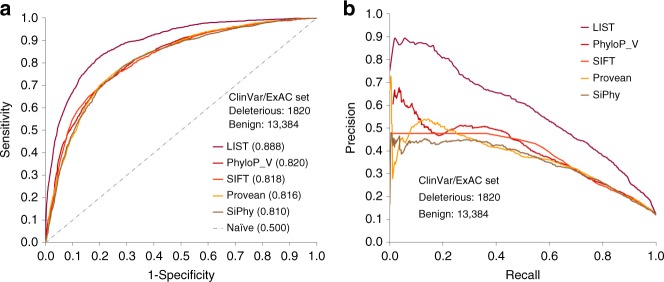
Fig. 3.
LIST performs better than other predictors in separating benign and pathogenic variants. a ROC curves calculated for the predictions by LIST, phyloP_Vertebrata (phyloP_V), SIFT, PROVEAN, and SiPhy on the variants from the ClinVar/ExAC test set that are scored by all methods compared (Supplementary Table 3). Shown here are only the best performing methods that solely use conservation measures (see Supplementary Table 3 for the results of other methods tested). AUC values are provided for each method in parentheses. b Precision-recall curves for the same tools and data set

