Figure 2.
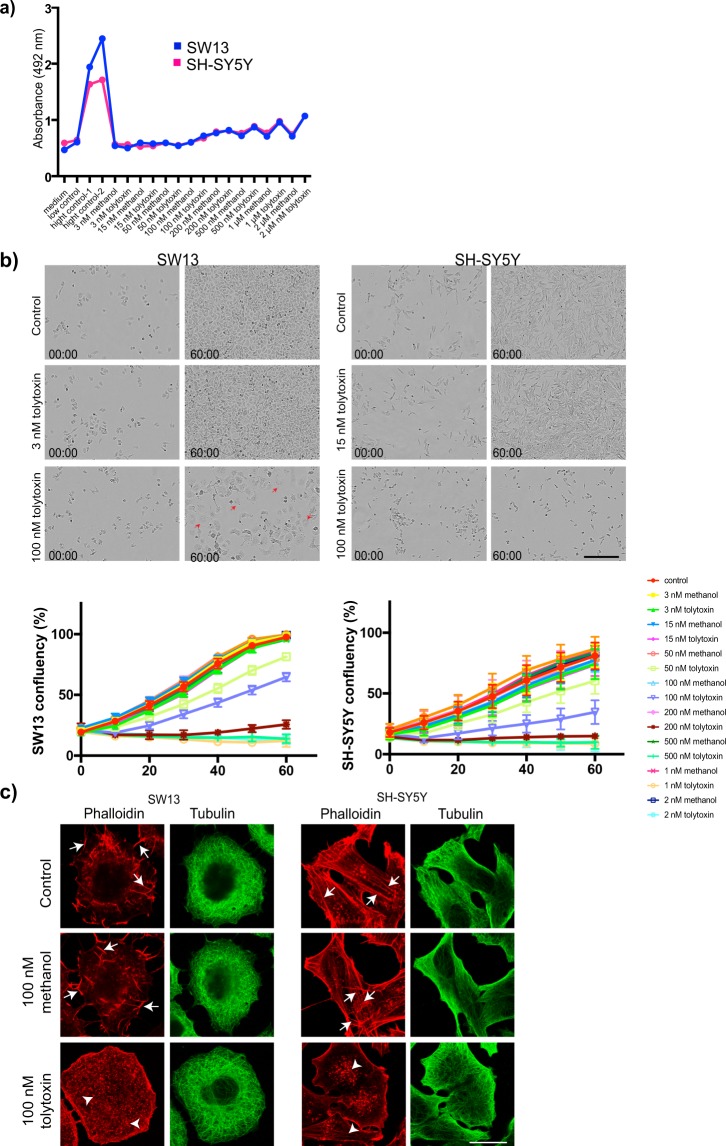
Effect of tolytoxin on cell viability, proliferation and cytoskeleton. (a) Lactate dehydrogenase release from three independent experiments are presented for SW13 and SH-SY5Y cells. medium: negative control, low control: LDH activity released from the untreated cells (spontaneous LDH release); high control-1: cells were lysed with 5 μl of lysis buffer; high control-2: cells were lysed with 10 μl of lysis buffer; tolytoxin and methanol treatments from 3 nM to 2 µM are indicated on the graph. (b) Cell confluency detection with Incucyte. Bright field images of control, 3 nM and 100 nM tolytoxin treated SW13 cells and control, 15 nM and 100 nM tolytoxin treated SH-SY5H cells at the beginning of acquisitions, time 0 (00:00), and at the end of acquisitions 60 h (60:00) are presented. Graphs showing the confluency of SW13 and SH-SY5Y cells over time in given concentrations of tolytoxin or methanol. Data were collected from two independent experiments. Scale bar: 150 µm. (c) Effect of tolytoxin on actin and microtubule cytoskeleton. Actin (rhodamine phalloidin) and microtubule (tubulin) labeling for SW13 (left) and SH-SY5Y cells (right) in control, 100 nM of tolytoxin or methanol treated cells. Arrows indicate actin filaments, arrowheads indicate disrupted actin filaments. One representative image is presented among four independent experiments. Scale bar: 10 µm.

