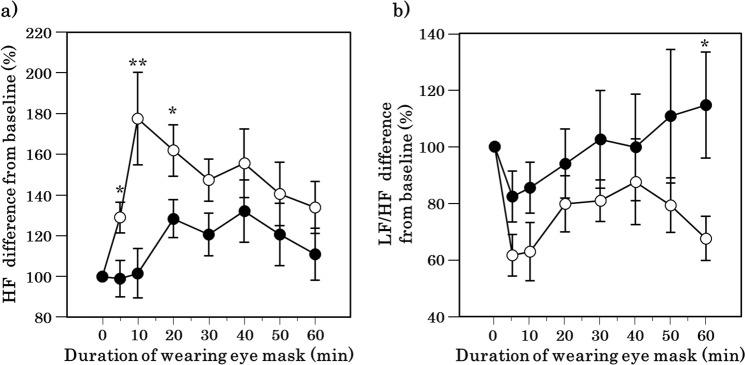
Figure 4.
Time course of heart rate variability after the periocular warming condition (open circle) and the sham condition (closed circle). (a) Change in the rate of high frequency (HF) for baseline (an index of cardiac parasympathetic activity). (b) Change in the rate of the ratio of low frequency to high frequency (LF/HF) for baseline (an index of cardiac sympathetic activity). All values are means ± s.e.m. Comparisons performed relative to sham condition using Wilcoxon signed rank test. *p < 0.05, **p < 0.01.

