Fig. 5.
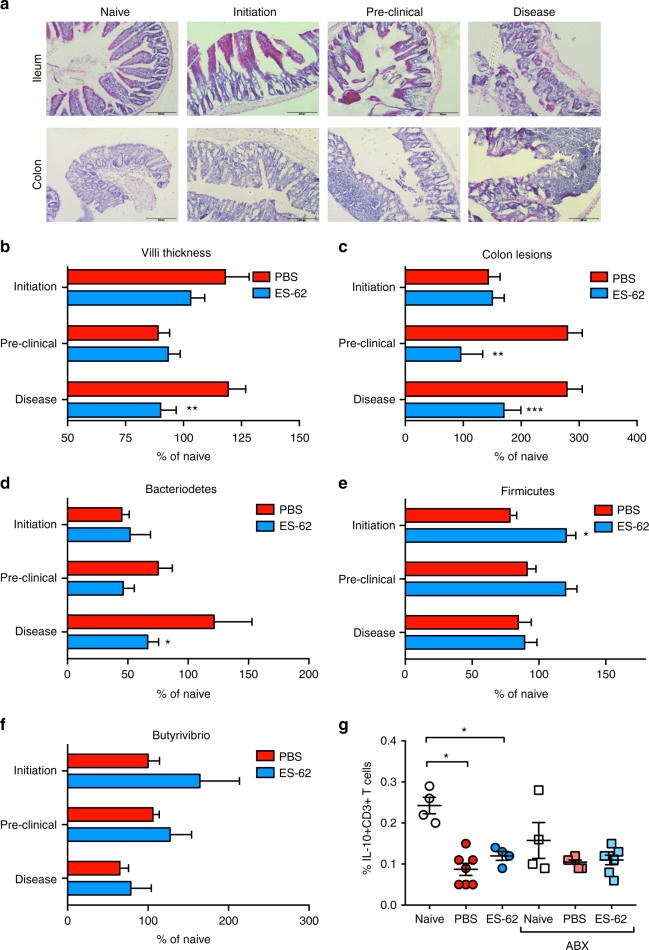
ES-62 protects against gut pathology occurring prior to onset of arthritis. a Representative H&E images (scale bars 200 µm) of ileum and colon of mice culled during the Naive, initiation (post immunisation ≤ d14), preclinical (d21 prior to challenge) and disease (established arthritis d ≥ 28, articular score PBS, 5.2 ± 0.8; ES-62–0.9 ± 1.24) phases of CIA. Changes in villus thickness (b; Initiation; PBS, n = 5, ES-62, n = 6, Pre-Clinical; PBS and ES-62, n = 3, Disease; PBS, n = 4, ES-62, n = 5 mice) and number of colon lesions (c; Initiation; PBS and ES-62, n = 12 images spanning six mice each, Pre-Clinical; PBS, n = 6 [3 mice], ES-62, n = 4 [2 mice]; Disease; PBS, n = 8 [4 mice], ES-62, n = 10 [5 mice]) were quantified using ImageJ analysis software with data normalised to values of Naive mice and presented as mean ± SEM. Statistical significance was determined using two-way ANOVA comparing PBS and ES-62 treatment at each time point where **p < 0.01 and ***p < 0.001. d–f Changes in Bacteroidetes (d), Firmicutes (e) and Butyrivibrio (f) populations in the colon faecal matter of Naive, PBS- and ES-62-treated animals were measured by qPCR, normalised to total bacterial content and presented as % Naive mice. Data are presented as mean ± SEM values from individual animals (Initiation; n = 6, Pre-Clinical; n = 3, Disease; n = 10) and statistical significance determined using two-way ANOVA with LSD Fishers multiple comparisons where *p < 0.05, **p < 0.01 and ***p < 0.001. g Tr1 cells (CD3+IL-10+ cells) were determined by flow cytometric analysis of splenocytes from individual mice (Naive; n = 4, PBS; n = 7, ES-62; n = 4, Naive-ABX; n = 4 PBS-ABX; n = 6 and ES-62-ABX; n = 7) from a single experiment. Statistical significance was determined using one-way ANOVA with LSD Fishers multiple comparisons where *p < 0.05

