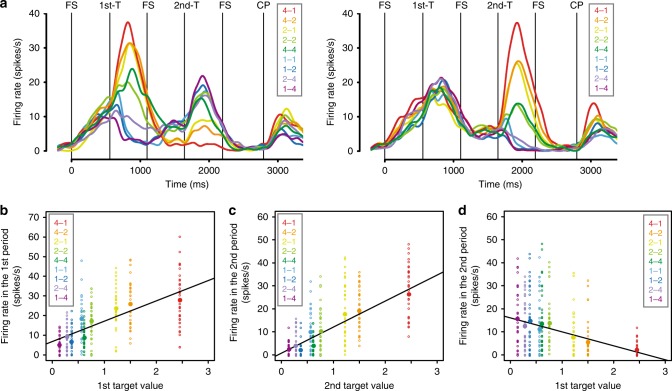
Fig. 2.
An example of value-related neuronal response (value difference neuron). a Left and right panels show the responses classified by the first and the second target, respectively. The reward amount and the schedule length of the choice target are abbreviated as “drop – trial”, and the colors correspond to the response in each target. These labels are ordered according to the estimated reward value. FS, fixation spot; 1st-T, first target; 2nd-T, second target; CP, choice phase. b Relationship between the first target value and the firing rate during the first target presentation period (GLM (Eq. 17), n = 340, R2 = 0.30, θ1: t = 13.89, p < 2.0 × 10⁻¹⁶). Dots: trials, filled large circles: average activity in each target value. c, d Relationship between the firing rate during the second target presentation period and c the second target value (GLM, n = 340, R2 = 0.48, α1: t = 17.63, p < 2.0 × 10⁻¹⁶) or d the first target value (GLM, n = 340, R2 = 0.13, α1: t = −7.29, p < 2.2 × 10⁻¹²). The same conventions as in b

