Fig. 4.
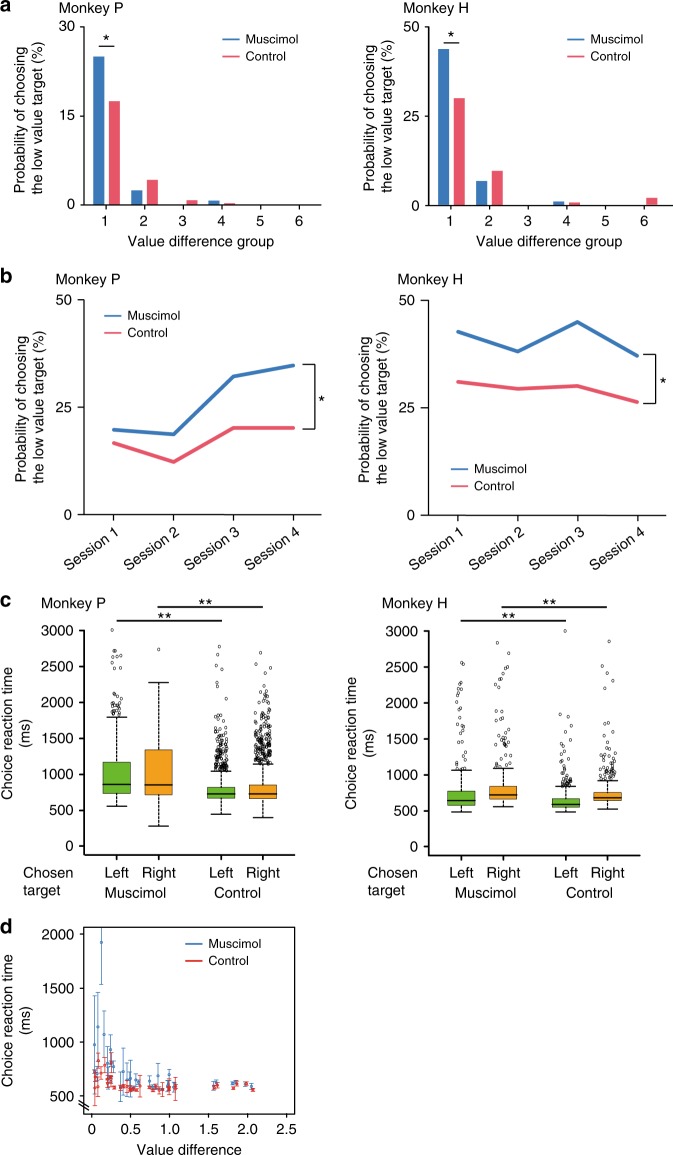
Effects of pharmacological OFC inactivation on choice performance. a Relationship between the choice probability of choosing the low value target and the difference in value. The difference in values were ordered from lowest to highest, and then these values were divided into six groups according to the value difference (Each group has data of 6 combinations of alternatives. Group 1 was the smallest value difference group. See Supplementary Table 1 and 2). *p < 0.05 (Proportion test, FDR correction). b Session-by-session analysis of the probability of choosing the low value target in the smallest value difference group (Group 1 in a). *p < 0.05 (GLMM). c Choice reaction time. Green and orange boxplots indicate the reaction time for the choice of the left and the right side target, respectively. Circles; outliers, **p < 0.01. d Relationship between the value difference and the choice reaction time (choice of the left target in monkey H). Error bar: SEM

