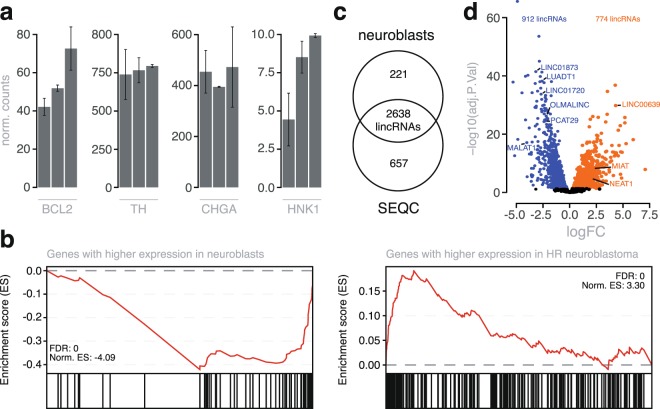
Figure 3.
Establishing the neuroblast lincRNome. (a) Expression profiles of neural and chromaffin markers in the neuroblast samples (mean epxr. +/− SE). (b) GSEA results on a logFC ordered mRNA list, derived from differential expression analysis between neuroblasts and high-risk NB tumors, using neuroblast/HR NB specific gene sets. (c) Number and overlap of expressed lincRNAs in neuroblast and NB samples. (d) Volcano plot of differentially expressed lincRNAs between neuroblasts and high-risk neuroblastoma samples at q < 0.05. The orange dots represent upregulated genes (774 lincRNAs) in HR NB samples, whereas the blue dots depict genes with a lower abundance (912 lincRNAs).

