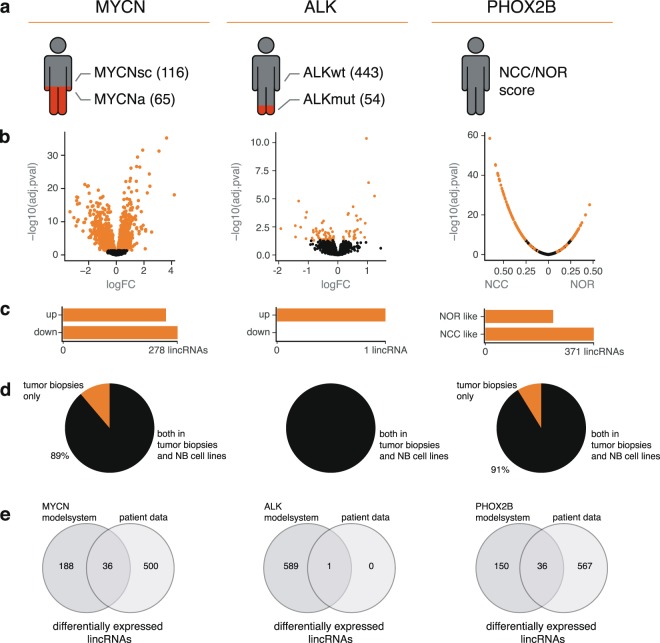
Figure 5.
Regulation of lincRNAs by key driver genes. (a) Depiction of number of samples in our dataset for the three subtypes of genomic aberrations. (b) Volcano plot showing differentially expressed lincRNAs using all samples mentioned in (a) at q < 0.05 (orange dots). In the case of PHOX2B, correlation coefficient and adjusted p-value are represented. Here, the orange dots represent genes with opposing signs and significance for their correlation with the CRC scores. (c) Number of differentially expressed lincRNAs for MYCN and ALK. The far-right bar plot represents the number of lincRNAs found to be significantly correlated with both the PHOX2B CRC and JUN/FOS CRC in opposing directions. (d) Percentage of differentially expressed lincRNAs that are expressed in both the CCLE NB cell lines and the SEQC data set, or solely in the tumor biopsies. (e) Overlap of differentially expressed lincRNAs found in the SEQC analysis and after perturbation of the driver genes in the corresponding model systems (p < 0.05).

