Figure 6.
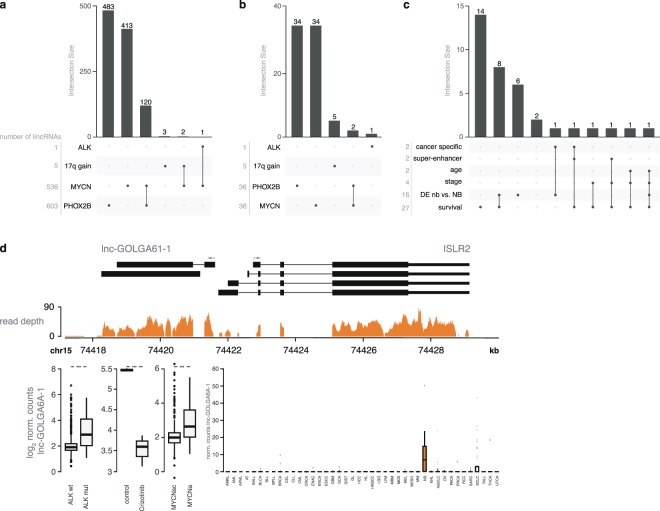
Association of lincRNAs with genetic and clinical parameters. (a) Number of lincRNAs regulated by one or more driver gene(s) or differentially expressed upon copy number variation in the patient samples. (b) Number of lincRNAs regulated by one or more driver genes or differentially expressed upon copy number variation, for lincRNAs differentially expressed in both the patient samples and model systems. (c) Number of lincRNAs regulated by MYCN, associated with clinical and genetic features. (d) Representation of the genomic locus and RNAseq data of lnc-GOLGA6A-1. lnc-GOLGA6A-1 expression levels in ALK wild type and mutated samples, and MYCN amplified and single copy samples are shown, together with expression of the lincRNA upon crizotinib treatment, an ALK inhibitor. The boxplot shows the expression pattern of lnc-GOLGA6A-1 across the different cancer types.

