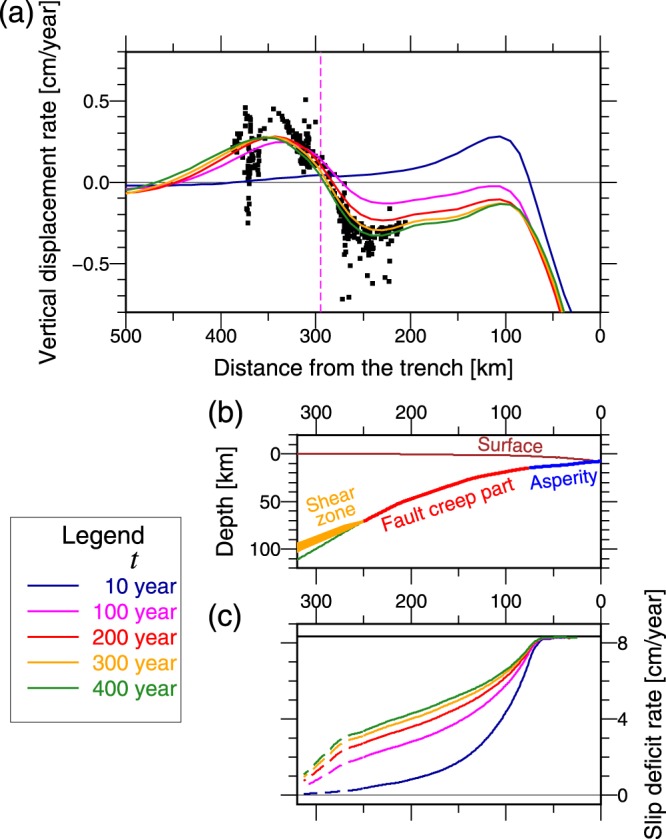
Figure 3.

Results of the model of interplate coupling. (a) Modeled vertical displacement rate () on the surface and observed . Colored lines indicate the modeled at each t, where t is the time from when the locking of the asperity begins. Black dots indicate the observed for ~100 years before the 2011 Tohoku earthquake based on leveling data (same as Fig. 1(d)). Pink vertical dashed line indicates the location of the volcanic front. (b) Cross section of the plate interface of the model with boundary conditions. Green line indicates the slab’s upper surface. (c) Modeled slip deficit rate (vsd) on the plate interface (solid lines) and across the shear zone (dashed line) at each t. Thick horizontal black line (vsd = 8.35 cm/year) indicates the full interplate coupling. Figure was created using the GMT57.
