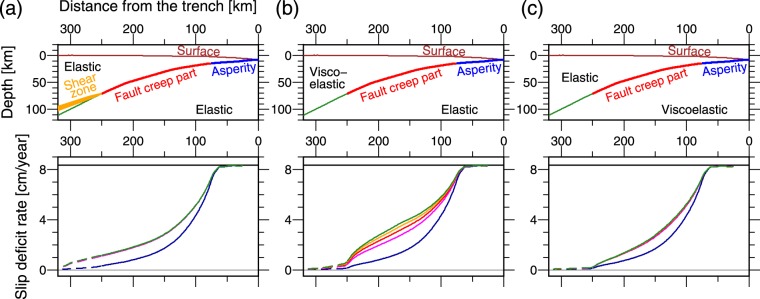
Figure 4.
Modeled slip deficit rate based on several test cases of the model of interplate coupling to examine the cause of increasing slip deficit rate with time. Plots are similar to those shown in Fig. 3(b,c) (see the legend in Fig. 3). (a) All material is elastic except for the thin viscous layer in the fault creep part and shear zone. (b) No shear zone, continental crust and mantle are viscoelastic, which the viscosity distribution is the same as the original model, and oceanic crust and mantle are elastic. (c) No shear zone, continental lithosphere and mantle are elastic, and oceanic crust and mantle are viscoelastic, which the viscosity distribution is the same as the original model. Figure was created using the GMT57.

