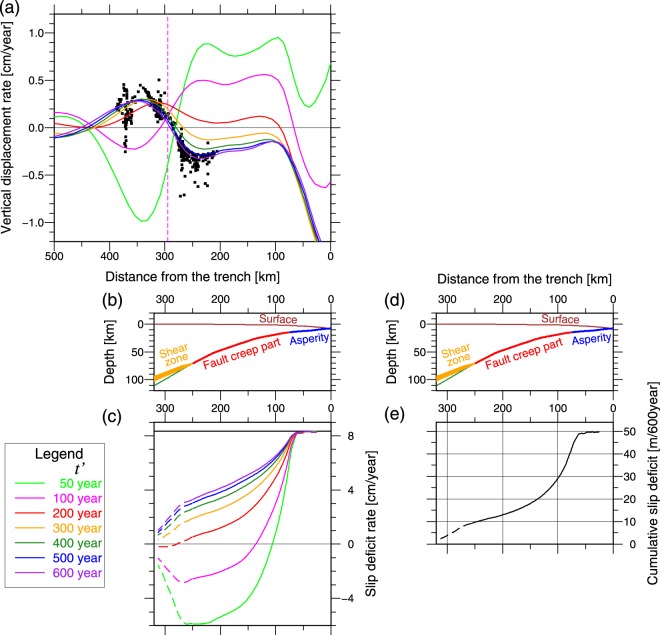
Figure 5.
Results of the model of earthquake cycles. (a–c) The plots are similar to those in Fig. 3(a–c). t′ is the time from the fifth earthquake. (c) Negative slip deficit rate indicates that the fault slip rate exceeds the long-term plate convergence rate, i.e., it means afterslip. (d) The plots are the same to (b). (e) Modeled cumulative slip deficit during one earthquake cycle. Black curve line indicates the modeled cumulative slip deficit on the plate interface (solid line) and across the shear zone (dashed line) during one earthquake cycle. This was calculated by integrating the positive slip deficit rate during the earthquake cycle. Figure was created using the GMT57.

