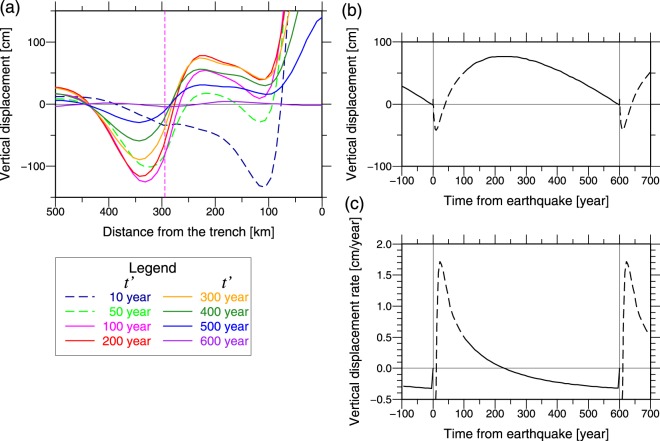
Figure 6.
Modeled vertical displacement on the surface in one earthquake cycle. (a) Colored lines indicate the modeled cumulative vertical displacement on the surface, which has accumulated since just before the occurrence of the latest (fifth) earthquake at t′ = 0. t′ is the time from the fifth earthquake. t′ = 600 year is the time just before the next earthquake. Vertical pink dashed line indicates the volcanic front. (b) Time series of the modeled vertical displacement at the surface near the coastal line (230 km from the trench). Zero of the vertical displacement corresponds to the vertical position just before the latest earthquake occurred at t′ = 0. Our model could not represent well the crustal deformation in the earlier postseismic period (dashed line) because there is a delay of several years in the earthquake slip propagation and no transient deformation was considered. (c) Time series of the modeled vertical displacement rate at the surface near the coastal line (230 km from the trench). Figure was created using the GMT57.

