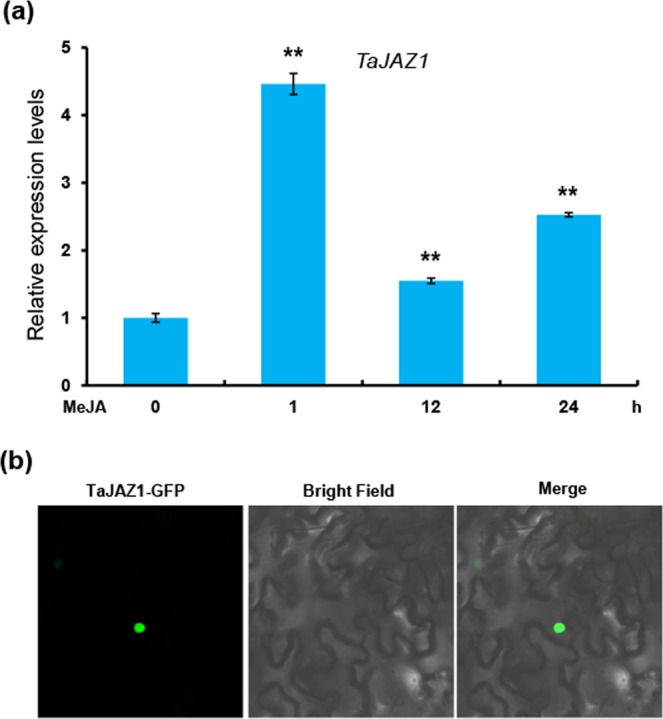
Figure 2.

Expression pattern of TaJAZ1 in response to JA treatment and subcellular localization of TaJAZ1. (a) qRT-PCR showing the induction of TaJAZ1 by JA treatment. Samples were collected from KN199 treated with MeJA at different time points. The relative transcript levels of TaJAZ1 were quantified by qRT-PCR and normalized against TaGAPDH. Error bars denote ± SD (n = 3). **P < 0.01 (Student’s t test). (b) Subcellular localization of TaJAZ1. The 35 S:TaJAZ1-GFP was expressed in N. benthamiana leaves. GFP signal was detected 48 h post infiltration. The experiment was performed independently three times with similar results.
