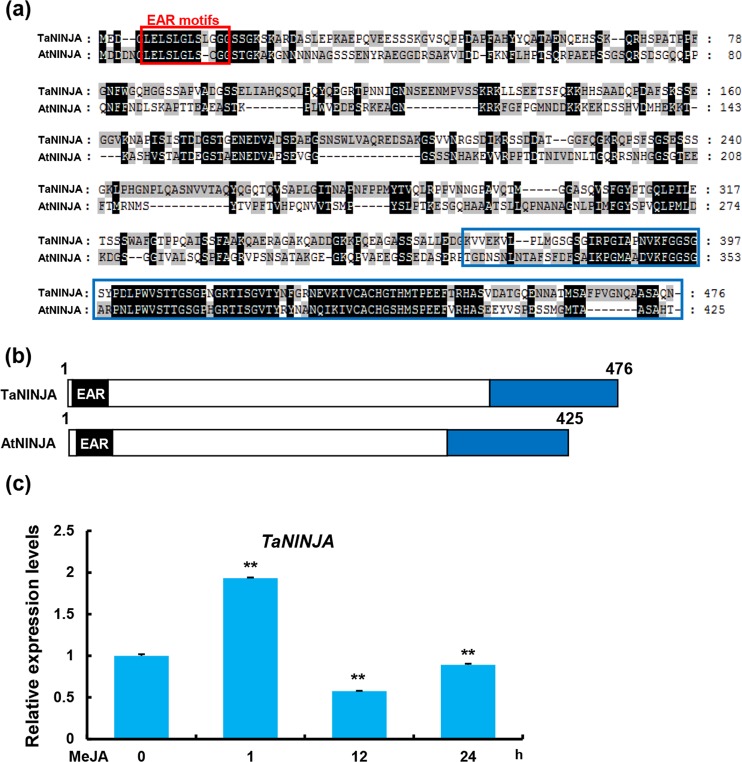
Figure 9.
Molecular characterization of TaNINJA and MeJA-induced expression pattern of TaNINJA. (a) Sequence alignment of TaNINJA and AtNINJA proteins. Red frame represents the EAR motifs. Blue frame represents a conserved domain. Amino acid variations among TaNINJA and AtNINJA are marked by gray- and white-shaded background. (b) The box diagrams of the protein structures of TaNINJA and AtNINJA. (c) MeJA-induced expression pattern of TaNINJA. qRT-PCR were performed to determine the relative transcript levels of TaNINJA in the MeJA-treated KN199 leaves at different time points. The levels of TaNINJA were normalized against TaGAPDH. Error bars denote ± SD (n = 3) (**P < 0.01, Student’ s t test).

