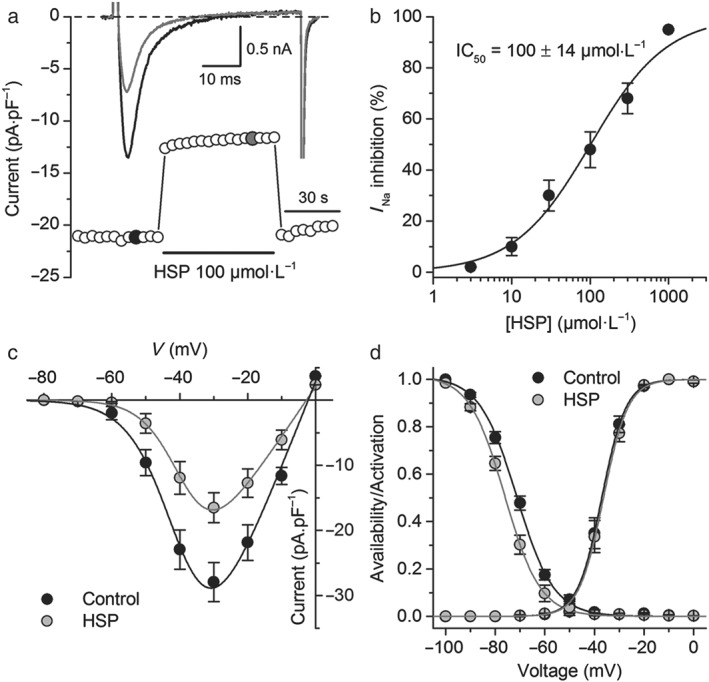
Figure 2.

Hesperetin (HSP) inhibits I Na in rat ventricular isolated cardiomyocytes. (a) Time course of the I Na in rat ventricular cardiomyocytes in control condition and in the presence of hesperetin (100 μmol·L−1). Representative current traces in each condition are shown in the inset and correspond to the coloured data points. (b) Concentration–effect relationship for the inhibitory action of hesperetin on I Na. The dots represent the mean ± SEM inhibition percentage during the application of different concentrations of hesperetin (n = 10 cells isolated from six hearts). The line represents the Hill fit of the data, and the inset shows the IC50. (c) Current–voltage relationships obtained in control condition and in the presence of hesperetin (100 μmol·L−1). The dots represent the mean ± SEM (n = 5 cells from five hearts). Hesperetin significantly decreased the current compared with control in the range of voltage from −50 to +10 mV (P < 0.05, paired t test). (d) Availability and activation curves obtained in control condition and in the presence of hesperetin (100 μmol·L−1). The dots represent the mean ± SEM (n = 5 cells from five hearts). Hesperetin significantly shifted the availability curve compared with control (P < 0.05, paired t test)
