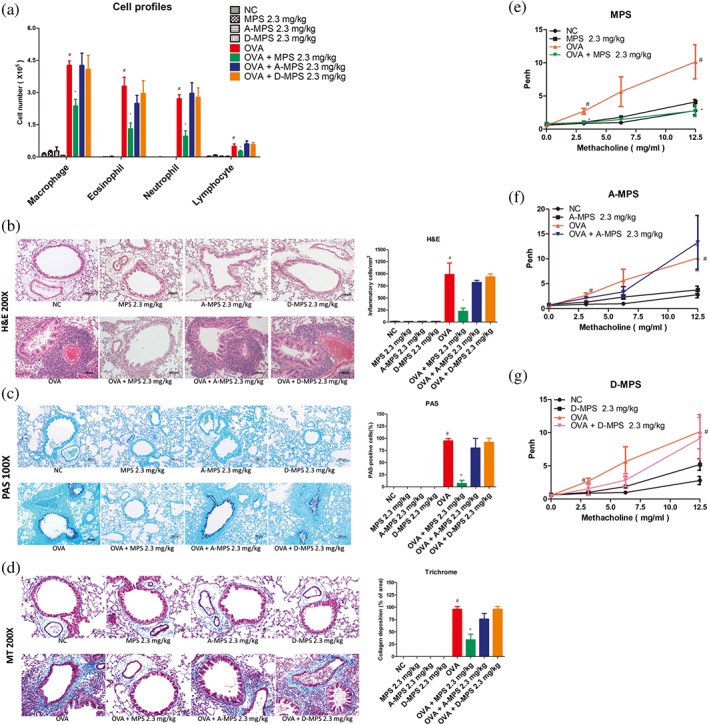
Figure 5.

The effects of MPS peptide, A‐MPS, and D‐MPS on asthma symptoms in steroid‐resistant mice. (a) BAL differential cell counts were assessed via May–Giemsa staining. (b–d) Lung sections were stained using H&E, PAS, and Masson's trichrome (MT) to assess inflammatory cell infiltration, mucus production, and collagen deposition around the airways, respectively. High magnification bar represents 100 μm for H&E and MT and 200 μm for PAS. (e–g) Airway resistance was determined through whole body plethysmography. Data are expressed as mean ± SD of pulmonary resistance values (RL) (n ≧ 5). # P < 0.05, compared to the NC group; *P < 0.05, compared to the OVA group
