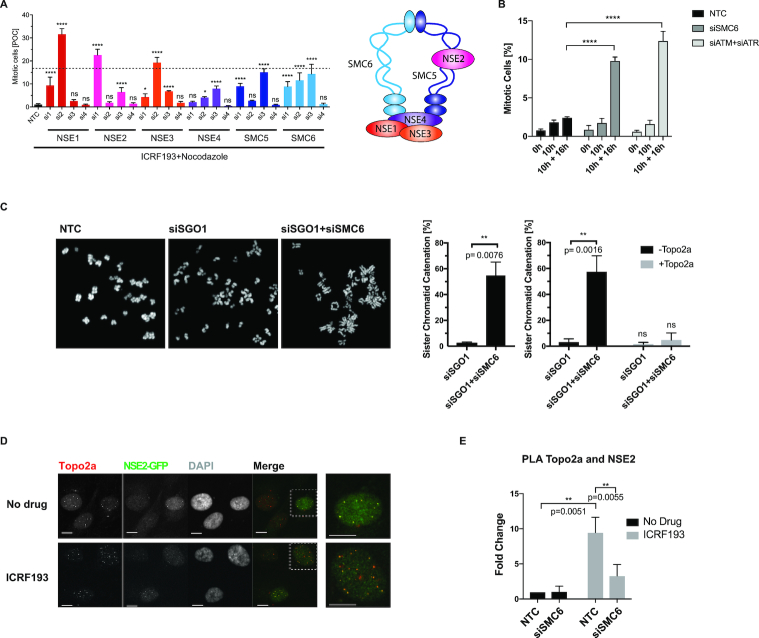
Figure 2.
The SMC5/6 complex regulates the Topo2a-dependent G2 arrest, sister chromatid disjunction and recruits NSE2 to Topo2a. (A) Asynchronous RPE1 cells were transfected with the indicated siRNAs, treated with 3 μM ICRF193 and 1 μM Nocodazole for 18 h and the MI were quantified and expressed as percentage of control (POC), in line with the Deconvoluted screen as described in the materials and methods (left panel). Data are represented as mean ± S.D. and are compared to the average siATM+siATR positive control MI of 16.7% with an S.E.M of 0.61 from n = 48 triplicate repeats, indicated by the dotted line. Schematic representation of the SMC5/6 complex (right panel). (B) U2OS cells were transfected with non-targeting control (NTC), SMC6 or siATM+siATR siRNA, synchronized with a double thymidine block, released for 10 h and then treated with 3 μM ICRF193 and 1 μM Nocodazole for a further 16 h. The mitotic index was determined through flow cytometry and staining for PI and MPM2. Data were normalized to 16 h of 1 μM Nocodazole alone and represented as mean ± S.D. n = 3. (C) Confocal images of chromosome spreads of RPE1 cells transfected with the indicated siRNAs with and without incubation of recombinant Topo2a in vitro. Bar graphs show quantification of SCI. Data are represented as mean ± S.E.M. (D) IF staining of RPE1 cells for NSE2-GFP and Topo2a after treatment for 18 h with 3 μM ICRF193 as indicated. White dotted boxes highlight enlarged images displayed on the right. Scale bar = 10 μm. (E) MATLAB-aided quantification, as described in the IF image analysis section of the Materials and Methods, of PLA experiments using antibodies for Topo2a and NSE2-GFP. RPE1 cells were transfected with non-targeting control (NTC) or siSMC6 for 55 h and treated with 3 μM ICRF193 for a further 18 h. Data are represented as mean ± S.E.M.

