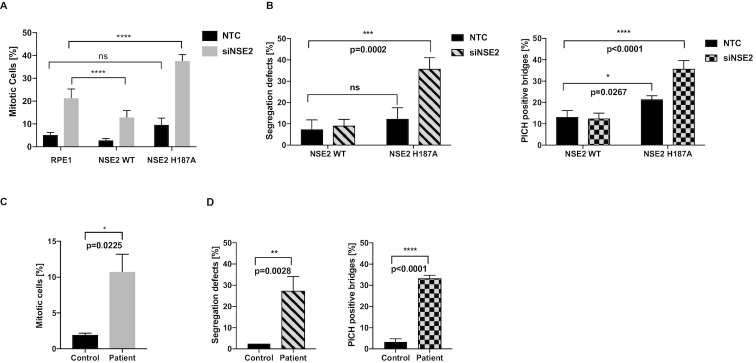
Figure 4.
Germline mutations demonstrate that NSE2 activity is required for the Topo2a-dependent G2 arrest. (A) Quantification of MIs by automated IF analysis of parental RPE1 cells and RPE1 cells stably expressing NSE2wt-GFP (NSE2 WT) or the ligase dead mutant NSE2H187A-GFP (NSE2 H187A). Cells were transfected with the indicated siRNAs and treated with 3 μM ICRF193 and 1 μM Nocodazole for 18 h, fixed and stained for MPM2 and DAPI. The siNSE2 transfection caused a significant increase (P < 0.0001) in mitotic cells compared to NTC (non-targeting control) for each cell line. Data are normalized to 1 μM Nocodazole alone and are represented as mean ± S.D. of a representative experiment of n = 3 with six technical replicates. (B) RPE1 cells stably expressing siNSE2-resistant NSE2wt-GFP or the ligase dead mutant NSE2H187A-GFP transfected with the indicated siRNAs were 48 h later fixed and stained for PICH and DAPI. Quantification of segregation defects as defined by chromatin bridges or lagging chromosomes and PICH-positive ultrafine bridges. Data are represented as mean ± S.D. A two-tailed t-test was used to analyse statistical significance. n = 3 with each 40 cells. (C) Quantification of MIs by FACS analysis of control and patient fibroblasts treated with 3 μM ICRF193 and 1 μM Nocodazole for 24 h, fixed and stained for MPM2 and PI. Data are normalized to 1 μM Nocodazole alone and are represented as mean ± S.D.. A two-tailed t-test was used to analyse statistical significance. n = 3. This data is part of Supplementary Figure S5D. (D) Control and patient fibroblasts were fixed and stained for PICH and DAPI. Quantification of segregation defects as in (B).

