Figure 4.
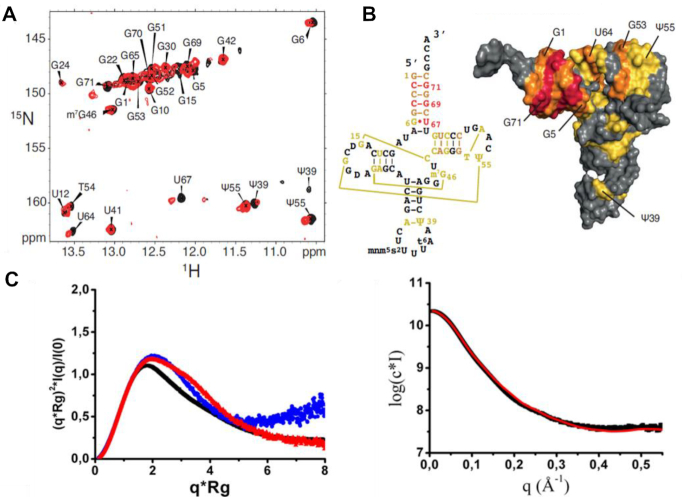
Identification of the binding interface of dsRBD on tRNA. (A) (1H,15N)-TROSY of 15N-labeled tRNALys3 in its free state (black) and in the presence of 1 equivalent of dsRBD (red). (B) left: secondary structure of human tRNALys3 showing the nucleotides that are affected upon dsRBD binding (strongly affected in red: Δδ > 0.15 ppm; moderately affected in orange: Δδ > 0.08 ppm; slightly affected in yellow: Δδ > 0.03 ppm). right: Representation on the surface of human tRNALys3 (pdb 1FIR) of the nucleotides affected upon dsRBD binding. The same color code is used. (C) SAXS characterization of dsRBD, human tRNALys3 and their reconstituted complex in vitro. Left: Normalized Kratky plot for tRBD (blue), tRNALys3 (red) and their complex (black). Right: ab initio multiphase reconstruction of tRBD-tRNALys3 complex SAXS data using a three-phase model by MONSA. The experimental curve is shown in black while in red is the theoretical curve from the MONSA model (χ2 = 3.78).

