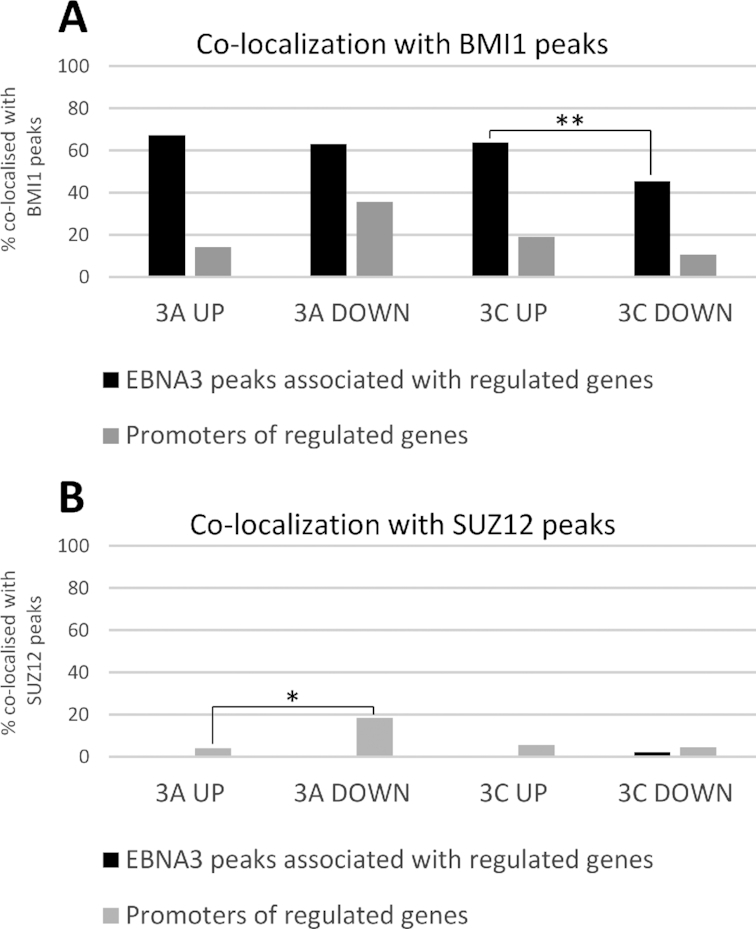
Figure 3.

Co-localization of BMI1 and SUZ12 peaks with promoters of EBNA3-regulated genes and EBNA3 peaks directly associated with EBNA3-regulated genes. (A) Percentage of BMI1 peaks co-localized with EBNA3A or EBNA3C peaks directly associated with EBNA3A/C up- or down-regulated genes (black bars) and BMI1 peaks co-localized with promoters of EBNA3A/C-up- or down-regulated genes (grey bars). EBNA3A/C directly regulated genes determined previously (22). Promoters defined as the region from 500 bp downstream to 1000 bp upstream of the transcription start site of each gene. Peaks were considered as directly associated with EBNA3-regulated genes if found within contact domains that also contained the EBNA3-regulated gene’s transcription start site. Pearson’s chi-squared test indicated statistically significant difference (P < 0.01) where indicated (**). (B) Same co-localization analysis as in (A), but for SUZ12 peaks. Pearson’s chi-squared test indicated statistically significant difference (P < 0.05) where indicated (*).
