Figure 5.
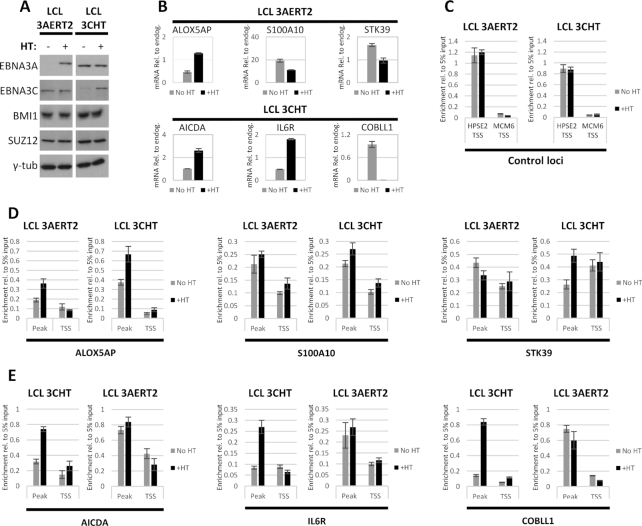
BMI1 is recruited to EBNA3-regulated genes by EBNA3C. LCL infected with recombinant EBV expressing either a conditional EBNA3A (3AERT2) or a conditional EBNA3C (3CHT) activated by adding HT to the culture medium. For both LCLs, HT had never been added to the medium prior to experiment shown. HT was added to half the culture of each LCL and cells grown with or without HT were harvested 14 days after HT addition. Representative results from one of three independent experiments are shown. (A) Activation and stabilization of 3AERT2 and 3CHT were verified by western blotting. BMI1 and SUZ12 protein levels did not change after HT addition. Γ-Tubulin was used as loading control. (B) RT-QPCR was performed to assess mRNA amounts and confirm that EBNA3A-regulated genes were activated (ALOX5AP) or repressed (S100A10 and STK39) as expected after addition of HT in the 3AERT2 LCL and EBNA3C-regulated genes were activated (AICDA and IL6R) or repressed (COBLL1) as expected after HT addition in the 3CHT LCL. Height of bars indicates mRNA levels, normalized to mRNA levels of endogenous control gene, GNB2L1. Error bars represent standard deviation from three QPCR replicates. (C) ChIP for BMI1 was carried out for No HT and +HT 3AERT2 and 3CHT cultures. Enrichment at a locus identified to be positive for BMI1 from the ChIP-seq experiment, but without evidence of significant EBNA3 occupancy was used as a positive control. No evidence of BMI1 or EBNA3 binding was found at MCM6 TSS from ChIP-Seq experiments and this site was used as negative control for the BMI1 ChIP. Height of bars represents enrichment relative to 5% of input chromatin. Error bars show standard deviation from three QPCR replicate reactions. (D) ChIP as in (C) showing enrichment of BMI1 at genes found to be up-regulated (ALOX5AP) or down-regulated (S100A10, STK39) by EBNA3A. Occupancy was assessed at the TSS of each gene and the locus directly associated with the TSS found to have the highest BMI1 peak by ChIP-Seq, for LCL 3AERT2 and LCL 3CHT. (E) Same as (D) for genes found to be up-regulated (AICDA, IL6R) or down-regulated (COBLL1) by EBNA3C.

