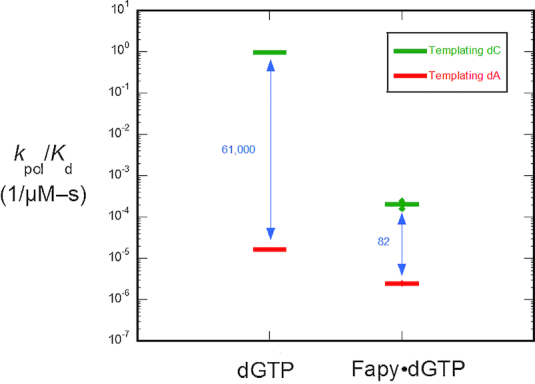
Figure 2.

Discrimination plot for insertion of β-C-Fapy•dGTP. The catalytic efficiencies (kpol/Kd) for insertion of β-C-Fapy•dGTP opposite dC (green) or dA (red) for wild-type (WT) pol β are shown. The distance between the respective catalytic efficiencies is a measure of discrimination/fidelity. Each horizontal short bar represents the mean of duplicate independent determinations. Additionally, the value for each determination is plotted (small solid circle) to illustrate the reproducibility of these assays. The insertion efficiencies for dGTP opposite dC and dA were taken from (39).
