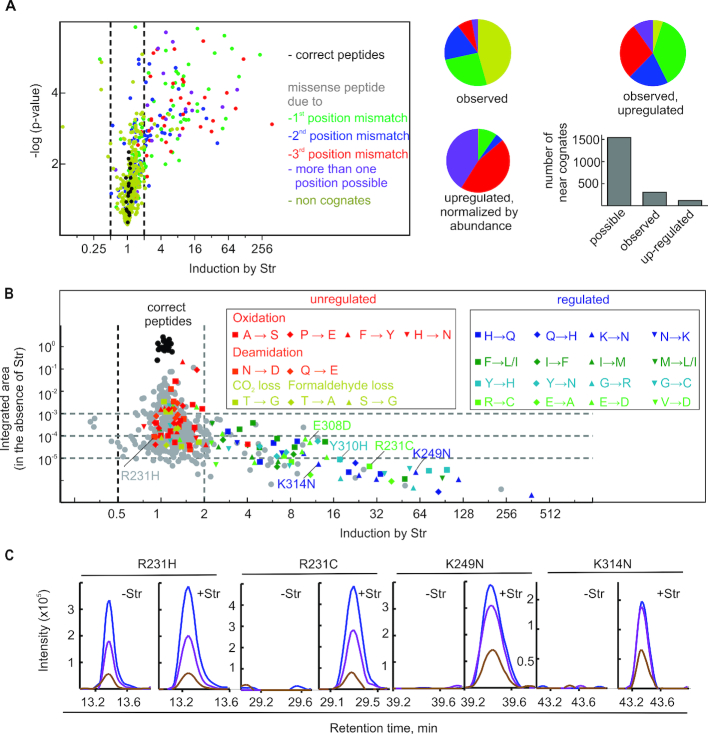
Figure 1.
Estimation of cellular error frequencies by DDA. (A) Str-induced missense peptides. The miscoding events leading to the respective amino acid substitutions are classified by the number of mismatches in the codon–anticodon helix: no mismatch, correct (black); one mismatch, near-cognate (green, blue, red; dependent on the position of the mismatch); if more than one particular mismatch can lead to the substitution (violet), or non-cognate (ocher) with two or three mismatches. Left panel, the volcano plot and statistical analysis are based on the integrated peak areas in four technical replicates (±4 μM Str) and a one tailored t-test. Right panel, pie diagrams: ratio of near- and non-cognates on the basis of the EF-Tu peptides included in the DDA analysis. Bar graph: number of near-cognate substitutions based on the EF-Tu peptides included in the DDA analysis. (B) Estimation of error frequencies in cells in the absence of Str. Integrated areas for amino acid subsitutions were normalized by the median of the integrated areas of the correct tryptic EF-Tu peptides. Identical time windows after retention time alignment between the runs were chosen for integration. For strong Str-induction this can lead to integration over noise in the absence of Str leading to error frequencies beyond the dynamic range of the mass spectrometer (see figure C). Left box: unregulated identifications that are isobaric to common artefacts. Right box: Amino acid substitutions that are consistently upregulated by Str. (C) Extracted molecular ion isotope peaks of selected missense peptides after MS1 filtering: with and without Str as indicated; M (blue), M+1 (violet), M+2 (brown).

