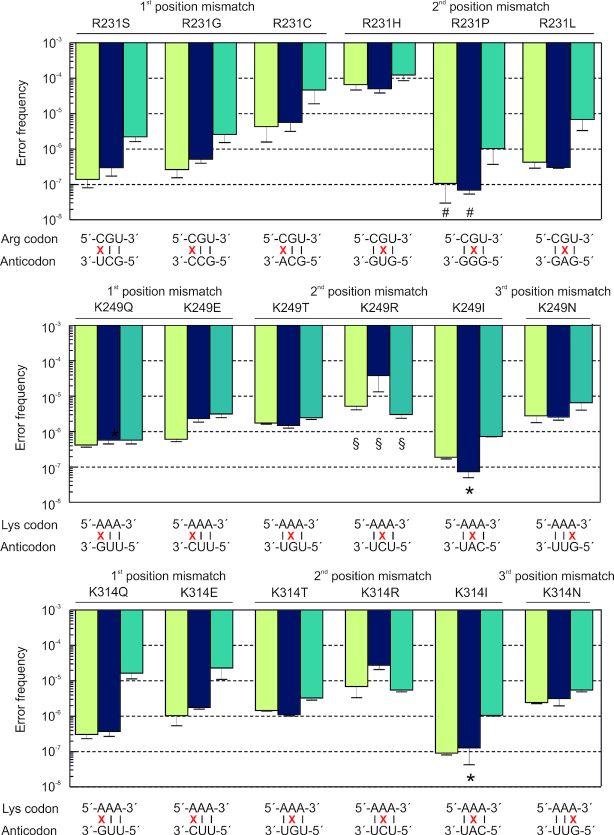
Figure 3.
Error frequencies of near-cognate misreading at three individual positions. Green bars, wild type chromosome-encoded EF-Tu from MRE600; blue bars, chromosome-encoded EF-Tu carrying a C-terminal His-tag (K12 strain); teal bars, plasmid-encoded EF-Tu overexpressed in BL21(DE3). Error bars represent the standard deviation of 3–5 biological replicates. For some amino acid substitutions a quantification was not possible and the bars represent an upper limit: * the endogenous peptide was too rare to be detected; # contaminations in the AQUA peptide masked the endogenous peptide; or § there were interferences even after multidimensional enrichment.

