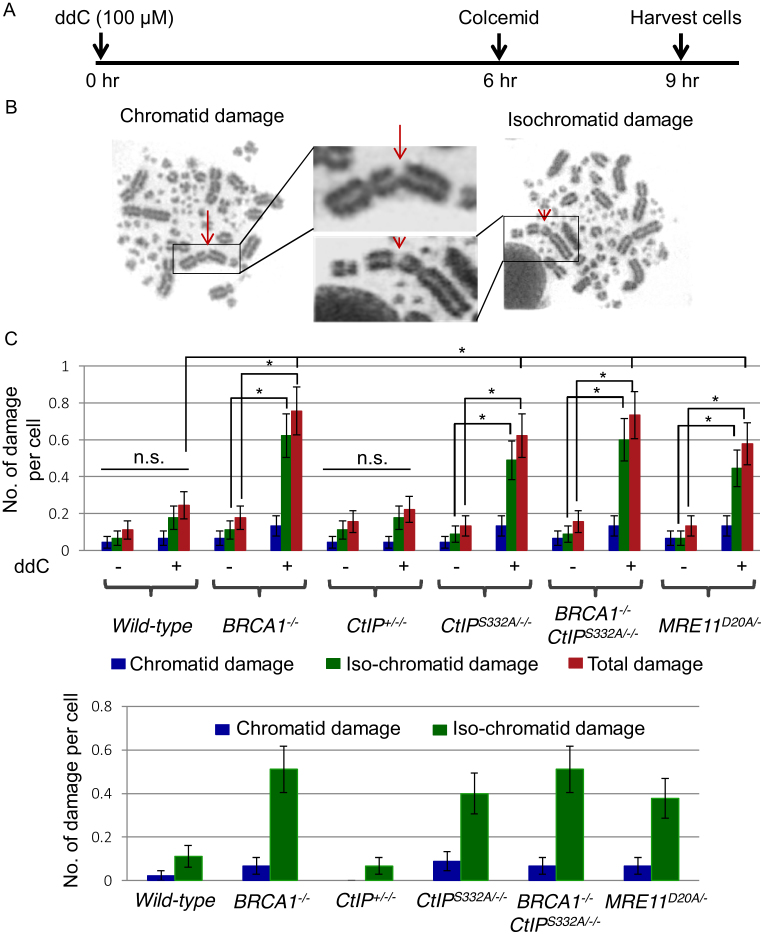
Figure 4.
BRCA1−/−, CtIPS332A/−/− and nuclease-dead MRE11D20A/− mutants exhibit increased number of ddC-induced chromosomal aberrations. (A) Schematic representation of the experimental protocol to measure chromosomal aberrations. (B) Representative images of chromatid damage (arrow) and isochromatid damage (arrowhead) after ddC treatment. (C) Number of damage per mitotic cells in the indicated genotypes (Upper panel). Error bars represent standard deviation. At least 50 mitotic cells were counted for each cell line. The P-value for Student's t-test was *P< 0.01. The subtracted numbers of damages before the exposure from damages after the exposure (Lower panel). Error bars represent standard deviation.

