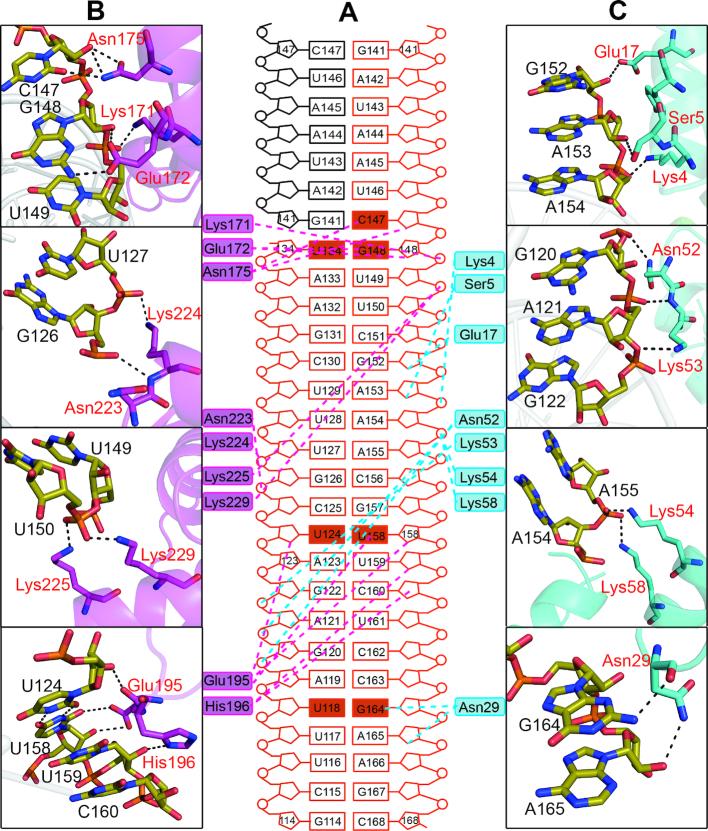
Figure 3.
The interactions of MLE dsRBD1+2 with R2H1. (A) Schematic of R2H1 interactions with MLE dsRBDs, colored as described in Figure 2. Cyan and magenta dotted lines indicate contacts between MLE dsRBD1, dsRBD2 and R2H1, respectively. The wobble base pairs and mismatches involved in the recognition of dsRBDs by MLE are highlighted as solid rectangles. (B) Higher magnification views of individual interactions between MLE dsRBD1 (red) and R2H1 (black). Hydrogen bonds are indicated with black dotted lines. (C) Higher magnification views of individual interactions between MLE dsRBD2 (red) and R2H1 (black). Hydrogen bonds are indicated with black dotted lines.

