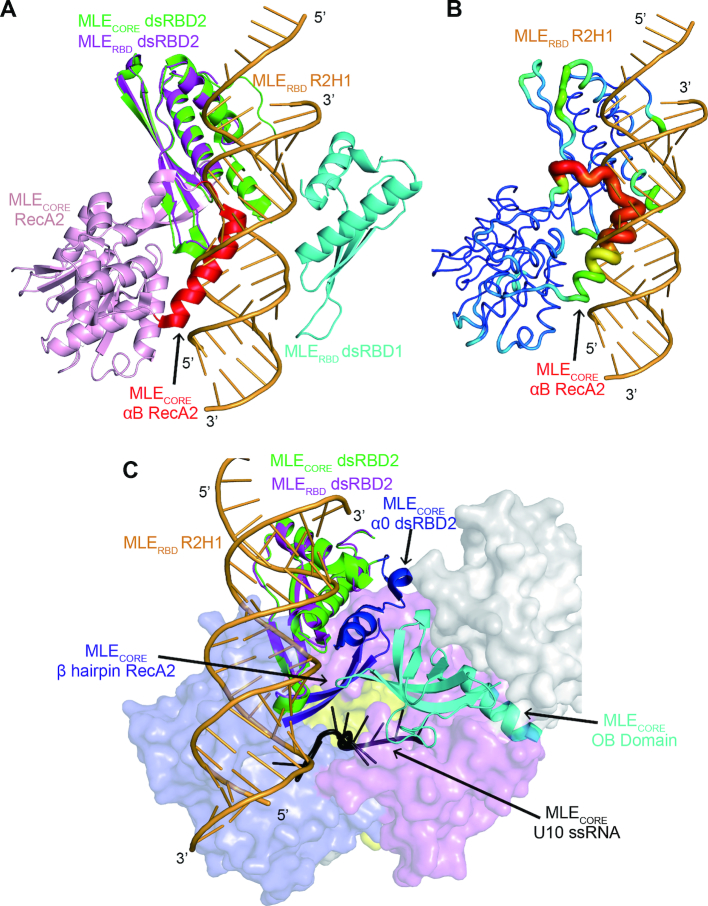
Figure 6.
Superposition of the MLE dsRBD1+2–R2H1 complex and MLEcore–U10–ADP–AlF4 complex. (A) The superposition of the MLE dsRBD1+2–R2H1 complex with the structure of the MLEcore–U10–ADP–AlF4 complex shows that helix αB of RecA2 (highlighted in red) in MLEcore possesses a physical barrier with the dsRNA–R2H1 in our complex. The MLE dsRBD1+2–R2H1 complex is colored as described in Figure 2A. For clarity, the MLEcore–U10–ADP–AlF4 complex only shows the structure of dsRBD2 (green) and the RecA2 domain (light pink). (B) The helix αB of RecA2 in MLEcore shows elevated B factors compared with those of other regions in MLEcore. For clarity, the MLE dsRBD1+2–R2H1 complex only shows R2H1, whereas the MLEcore–U10–ADP–AlF4 complex only shows the dsRBD2 and the RecA2 domain in B-factor mode in PyMOL. (C) N-terminal helix (α0) of MLEcore dsRBD2 is involved in the formation of the ssRNA-binding channel for poly-U. The MLEcore ssRNA-binding channel formed by the α0 of dsRBD2 (blue), the OB domain (cyan) and the hairpin of RecA2 (purple). The U10RNA is colored in black. For clarity, the MLE dsRBD1+2–R2H1 complex only shows the dsRBD2 and R2H1. The MLEcore ssRNA-binding channel and U10RNA are shown as cartoons, whereas the other domains of MLEcore–U10RNA complex are shown as surfaces with different colors.

