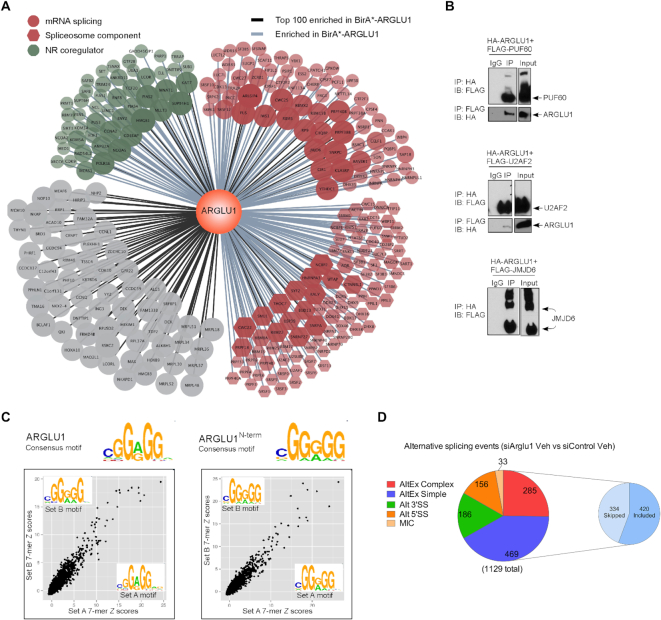
Figure 3.
ARGLU1 interacts with splicing factors, binds RNA and modulates the AS response in N2a. (A) ARGLU1 protein interaction network using BioID. BirA*-ARGLU1 enriched for 832 proteins (greater than 2-fold vs. BirA* control). The top 100 enriched proteins are connected to the central ARGLU1 node with a black line. Proteins connected with a light blue line are enriched but are not in the top 100. Proteins related to splicing as defined by g:Profiler results were shaded red. The subset of the splicing-related proteins that are specifically linked to the spliceosome (defined by the CORUM database) are represented as red hexagons. Proteins in green are known nuclear receptor coregulators as curated by the Nuclear Receptor Signaling Atlas (www.nursa.org). The size and transparency of the protein nodes are proportional to the protein fold-enrichment. Cytoscape was used to generate the ARGLU1 protein interactome. (B) Co-IP of HA-ARGLU1 and selected splicing modulators factors (FLAG-PUF60, FLAG-U2AF2 or FLAG-JMJD6) identified by MS. FLAG-JMJD6 runs as a multimer on a gel. Reverse IPs with the FLAG antibody led to the HA-ARGLU1 being pulled down with FLAG-PUF60 and FLAG-U2AF2. IP, immunoprecipitation; IB, immunoblot. (C) RNAcompete results for GST-ARGLU1 and GST-ARGLU1N-term (N-terminus intact). The scatter plots depict correlations between 7-mer Z-scores for set A and set B. Spots corresponding to enriched 7-mers are in the top right corner. Logos for consensus RNA binding motifs, averaged from set A and set B, were generated and shown at the top of the panel (logos for set A and set B are inset). The top ten 7-mers bound by the various ARGLU1 proteins (and corresponding Z-scores) are shown in Supplementary Figure S9A. (D). Classification of ARGLU1-regulated events. Pie charts showing the distribution of alternative spliced events following ARGLU1 knockdown in N2a cells (in the absence of ligand stimulation). AltEx refers to simple and complex cassette exon events; 3′SS, alternative 3′ splice site; 5′SS, alternative 5′ splice site; MIC, microexon. Pie chart inset: distribution of skipped or included exons within the combined simple and complex cassette exon category with ARGLU1 knockdown. See also Supplementary Figures S7–S9.

