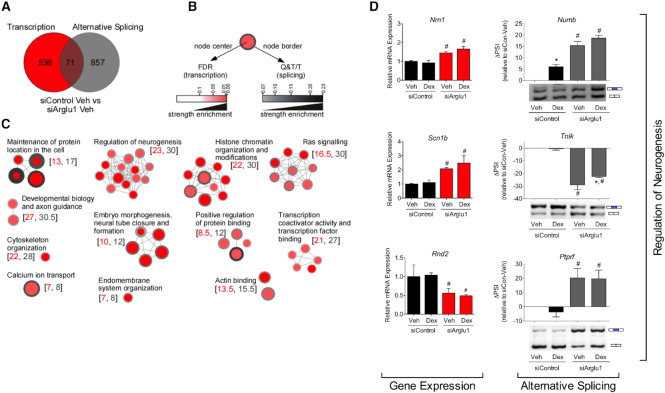
Figure 4.
ARGLU1 basally regulates biological processes through modulation of transcription and AS of separate genes. (A) Venn diagram showing limited overlap in genes alternatively spliced (PSI ≥ 15) and transcriptionally regulated (siArglu1/siControl log2 ratio ≤−0.81 or ≥0.81) by ARGLU1 in N2a cells in the absence of a ligand. Genes having more than one splicing event were only counted once. Legend in (B) for pathways demonstrating overlap between those basally regulated by ARGLU1 in alternative splicing vs. transcription (siArglu1 versus siControl). (C) Node size is proportional to the number of differentially expressed genes in a pathway (corrected by the size of the pathway). All these pathways have a significant enrichment FDR equal or less than 0.05 for both the alternative splicing and transcription gene lists. Related pathways are grouped together under a common label to form modules. The numbers in brackets correspond to the median number of genes for transcription (left) and alternative splicing (right) contained in each pathway module. FDR, false discovery rate. Q&T/T, number of genes in the overlap for each pathway corrected by the size of the pathway. (D) Genes involved in regulation of neurogenesis were altered upon ARGLU1 knockdown in N2a cells at both transcriptional and AS levels. One-step RT-PCR validation of splicing events with a ΔPSI ≥15 is shown. A representative image is shown below the Image J quantification of the blot. Data represent the mean ± SEM (n = 3). *P < 0.05 versus respective Veh, #P < 0.05 versus respective siControl; ANOVA followed by Neuman–Keuls test. See also Supplementary Figure S9.

