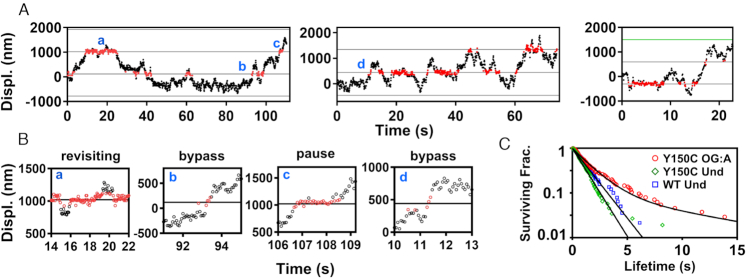
Figure 3.
Representative displacement trajectories showing MUTYH Y150C interactions with 8-oxoG:A damage. Segments of three individual scanning events are shown in (A). Red portions of the trace represent positions within +/- 100 nm of the damage site. (B) When portions of the trajectories from panel (A) are displayed with an expanded x-axis, MUTYH Y150C shows complex interactions with damage sites, including transient pauses, bypass events, and a combination of bind/release damage site revisitation behaviors. Bypass is indicated where interaction with the damage site is shorter than the 1.4 s mean transit lifetime for fast diffusion in the absence of damage. 8-oxoG:A damage sites are marked as black lines. Dye site is marked as a green line. (C) The survival fraction of MUTYH Y150C encounter event lifetimes (red circles) within ±100 nm of a known damage site. The population was fit with a double exponential to give lifetimes of 1.6 ± 0.3s (89%) and 10 ± 5s (11%), (120 damage encounter events, 5 trajectories). The survival fraction of MUTYH Y150C (green diamonds) and MUTYH WT (blue squares) encounters with random undamaged sites show single populations with lifetimes of 1.1 ± 0.1s (131 encounters, 5 trajectories) and 1.4 ± 0.2s (70 encounters, 3 trajectories), respectively. Lifetime values represent mean and standard deviation. See Supplementary Table S1 for sample statistics.

