Figure 5.
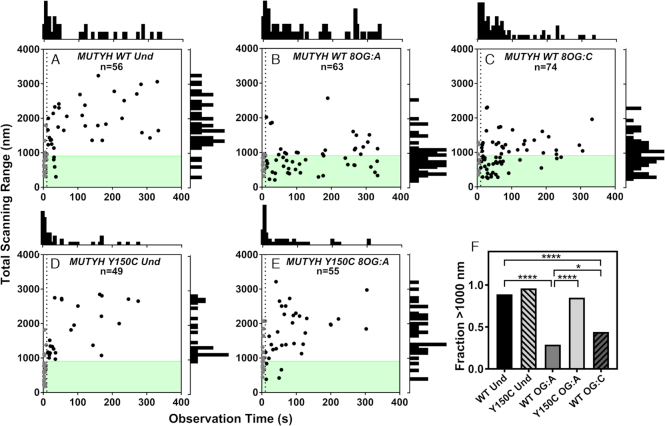
Total scanning distance range of glycosylases on concatemer substrates as a function of observation time. The total distance of DNA scanned is plotted as a function of how long the glycosylase was observed (A) MUTYH WT on undamaged, (B) MUTYH WT on 8-oxoG:A, (C) MUTYH WT on 8-oxoG:C, (D) MUTYH Y150C on undamaged, (E) MUTYH Y150C on 8-oxoG:A. In plots A-E, n represents the total number of tracked glycosylase trajectories. The dotted line is plotted at t = 10s, and gray points are molecules that were bound for less than 10s. A histogram of the time observed is shown above plots A-E, and a histogram of total scanning range for molecules observed for >10s is to the right side. The shaded green region indicates the length of one plasmid concatemer. For molecules that were bound for longer than 10s, the fraction of molecules in each condition that scanned more than 1000 nM is shown in (F). Significance was determined using chi square analysis (*p < 0.05, ****p < 0.0001).

