Figure 4.
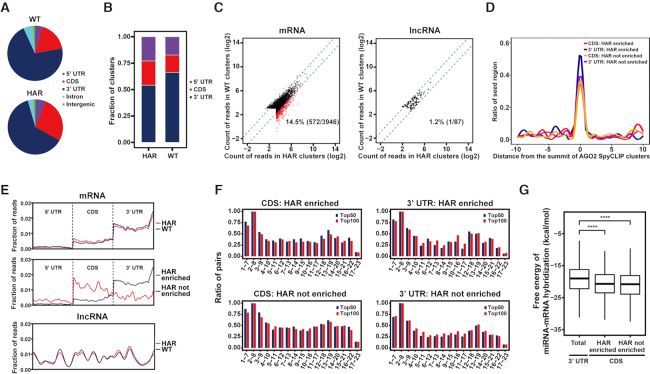
Characterization of miRNA target sites within the coding regions by SpyCLIP. (A) Distribution of AGO2 SpyCLIP clusters in different regions of protein-coding genes. WT: clusters identified under physiological conditions; HAR: clusters identified upon acute translation suppression by harringtonine. (B) Distribution of AGO2 SpyCLIP clusters in different genomic regions corrected by region size. WT and HAR are defined as in (A). (C) Changes of reads count in AGO2 SpyCLIP clusters between physiological (WT) and translation suppressed (HAR) conditions. Clusters in the HAR condition that exhibited at least a 2-fold increase over their counterparts in the WT condition are defined as HAR enriched and indicated by red dots. Other clusters are defined as HAR not enriched and indicated by black dots. (D) Complementary site density for all seed regions (nucleotides 2–8) of the top 100 miRNAs in the 20-nt region centered around the summit of AGO2 SpyCLIP clusters. (E) Distribution of reads within AGO2 SpyCLIP clusters along the transcripts of protein-coding or long noncoding RNAs. WT and HAR are defined as in (A). HAR enriched and HAR not enriched are defined as in (C). (F) Base-pairing tendencies of different regions within miRNAs to their complementary sites within AGO2 SpyCLIP identified clusters. Each 7-mer region (nucleotides 1–7, 2–8, 3–9, and so on) of the top 50 or top 100 AGO2-bound miRNAs was aligned with AGO2-bound clusters in the CDS or 3′ UTR of mRNAs identified by SpyCLIP to define a potential target site. The percentage of complementary sites in AGO2-bound clusters for each 7-mer region of the top 50 (blue bars) or top 100 (red bars) AGO2-bound miRNAs are plotted. (H) Free energy of miRNA-target duplex containing at least one 7-mer complement of the top 100 miRNAs defined in (F) in different categories of AGO2-bound clusters. ****P-value ≤ 0.0001.

