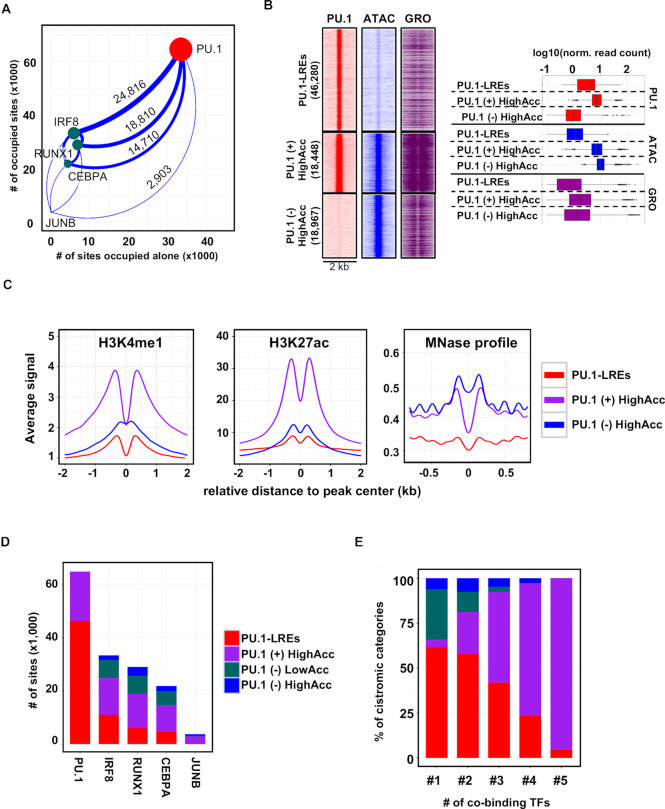
Figure 2.
PU.1-labelled regulatory elements are pervasive in macrophage, exhibiting low transcriptional activity and histone acetylation. (A) Scatter plot showing the total number of binding regions for each transcription factor (TF) cistromes (y-axis), and the number of sites where the particular TF does not overlap with any other TF (x-axis). The overlap of the PU.1 cistrome with all the presented TF cistromes is represented by the thickness of the connecting lines on which the actual numbers of overlapping genomic regions are shown. The sizes of the dots are proportional to the sizes of the TFs’ cistromes. (B) Read distribution (RD) plots showing PU.1 occupancies, chromatin openness (ATAC-seq) and nascent RNA transcription (GRO-seq) in the three groups clustered based on PU.1 occupancy and ATAC-seq signal. The following nomenclature was used for the three clusters: PU.1-labelled regulatory elements (PU.1-LREs), PU.1 positive highly accessible regions (PU.1 (+) HighAcc) and PU.1 negative highly accessible regions (PU.1 (−) HighAcc). RD plots show the signals in 2-kb windows around the summit of PU.1 or ATAC peaks. Box plot representations of PU.1 occupancy and chromatin accessibility in the three clusters from ChIP-seq and ATAC-seq experiments are also shown. (C) Meta histograms showing H3K4me1, H3K27ac signals and MNase-seq (38) signals for the three categories. Signals were measured around the summits of PU.1 (PU.1-LREs and PU.1 (+) HighAcc) or ATAC-seq signals (PU.1 (−) HighAcc). (D) Stacked bar plots with the number of binding regions from each cistrome using PU.1, RUNX1, CEBPA, IRF8 and JUNB ChIP-seq experiments in the context of the identified categories (PU.1-labelled regulatory elements (PU.1-LREs), ‘PU.1 (+) HighAcc’, ‘PU.1 (−) LowAcc’ and ‘PU.1 (−) HighAcc’). (E) Stacked bar plot showing the percentage of binding sites in each cistromic category presented on panel (D) as a function of the number of co-binding factors present at the given genomic loci (#1-5 labelling indicates the number of co-bound TFs for each cistrome).

