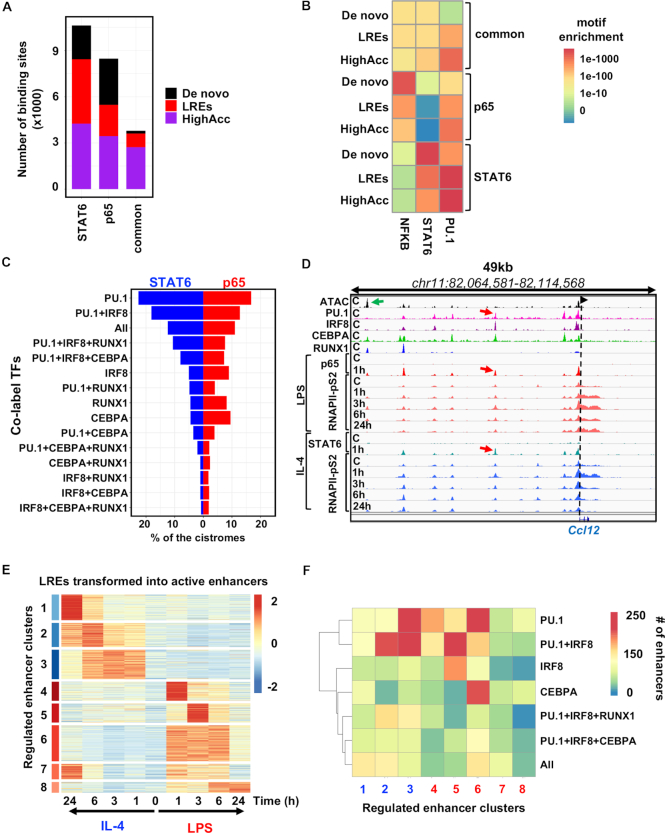
Figure 5.
Labelled regulatory elements are extensively and dynamically utilized by the signal-dependent transcriptional programs of macrophage polarization. (A) Stacked bar plot showing the distribution of de novo, labelled regulatory elements (LREs) and highly accessible chromatin regions (HighAcc) across STAT6-specific, p65-specific and commonly bound genomic regions by the two signal-dependent transcription factors (SDTFs). (B) Heat map showing the P-values of the motif (NFKB, STAT6 and PU.1) enrichments for the sets of de novo, LREs and HighAcc chromatin regions. (C) Balance bar plot showing the distribution of the STAT6 and p65 cistromes on the different subsets of transcription factor co-labelled regulatory element groups. TF combinations that co-label these LREs are presented on the y-axis, while the x-axis depicts the percentages of the STAT6 and p65 cistromes that overlap with them. (D) IGV snapshot of Ccl12 locus with a TF co-labelled regulatory element that can be used by both SDTFs (STAT6 and p65) and each of these two recruit the elongation-specific form of RNA polymerase II (RNAPII-pS2) with different kinetics upon LPS and IL-4 mediated macrophage polarization. (E) Heat map representation of the transformation of labelled regulatory elements (LREs) to active enhancers based on RNAPII-pS2 recruitment upon LPS or IL-4 mediated macrophage polarization on the time course of 1, 3, 6 and 24 h. Regulated enhancer clusters (ECs) (FC > 2 & P-value < 0.05) and normalized Z-scores of RNAPII-pS2 signals are shown. (F) Heat map depicting the highly enriched TF-LREs in the polarization induced enhancer clusters determined on panel (E). TF-LREs at least with 100 overlapping sites are shown.

