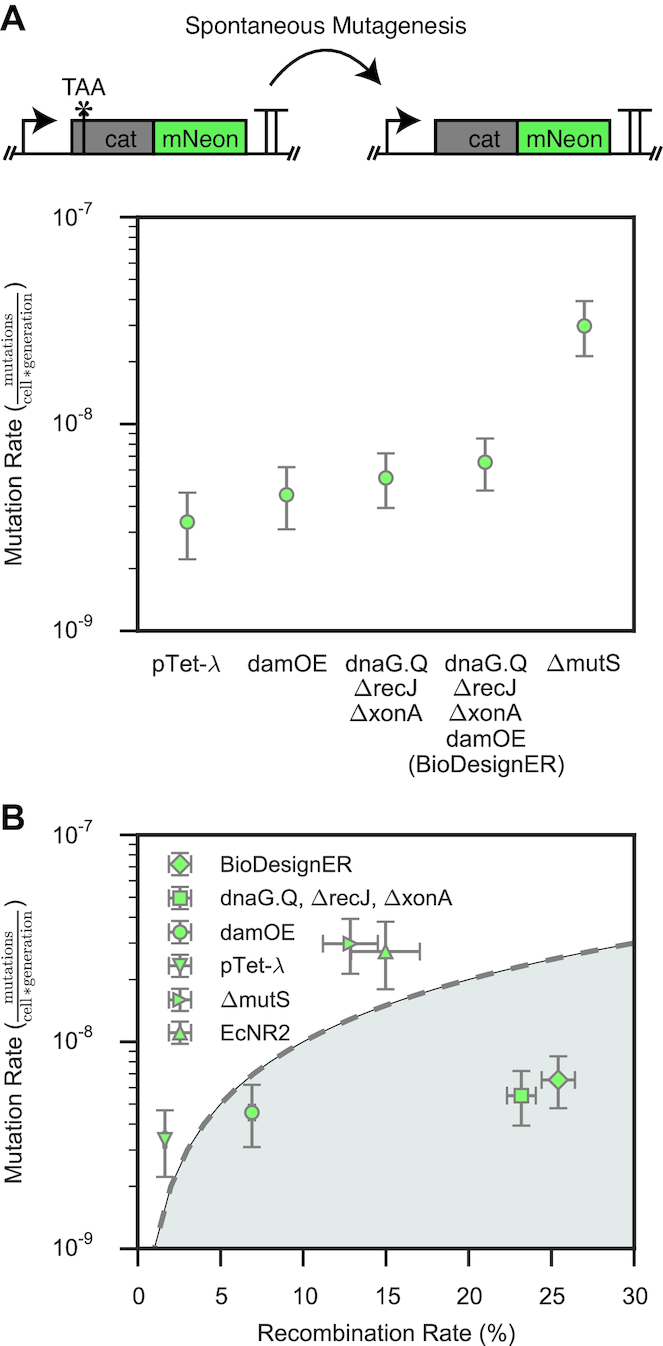
Figure 4.

Comparative mutational analysis of BioDesignER. (A) Background mutation rates (mutations/cell/generation) as measured via a cat-mNeon fluctuation assay for various stages of BioDesignER strain construction compared to an MMR-deficient (ΔmutS) strain derived from pTet-λ. Error bars represent 95% CI. (B) Single-cycle ssDNA recombination efficiency plotted against background mutation rate for each strain to show tradeoffs between recombination and mutation rates. The resulting tradeoff space represents the unit increase in mutation rate observed for a unit increase in recombination rate and is divided by y = β*x, where β = 10−9 is a characteristic scaling factor for the mutation rate. X-error bars represent ± 1 standard deviation and Y-error bars represent 95% CI.
