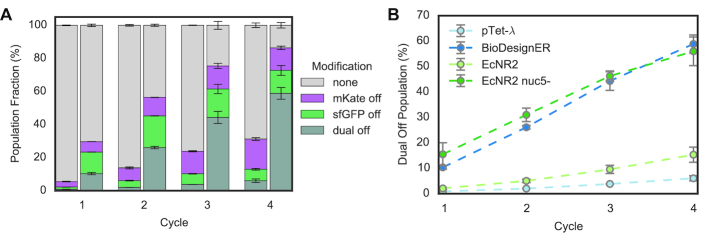
Figure 5.
Comparative multi-cycle, multiplexed recombineering of BioDesignER. (A) The fraction of each genotype (i.e. modification type) was measured via flow cytometry for pTet-λ (left) and BioDesignER (right) after each cycle of recombineering. Errors bars represent ± 1 standard deviation. (B) The fraction of each strain population in which both markers were edited (dual off genotype) is shown across all four recombineering cycles. Errors bars represent ± 1 standard deviation.

