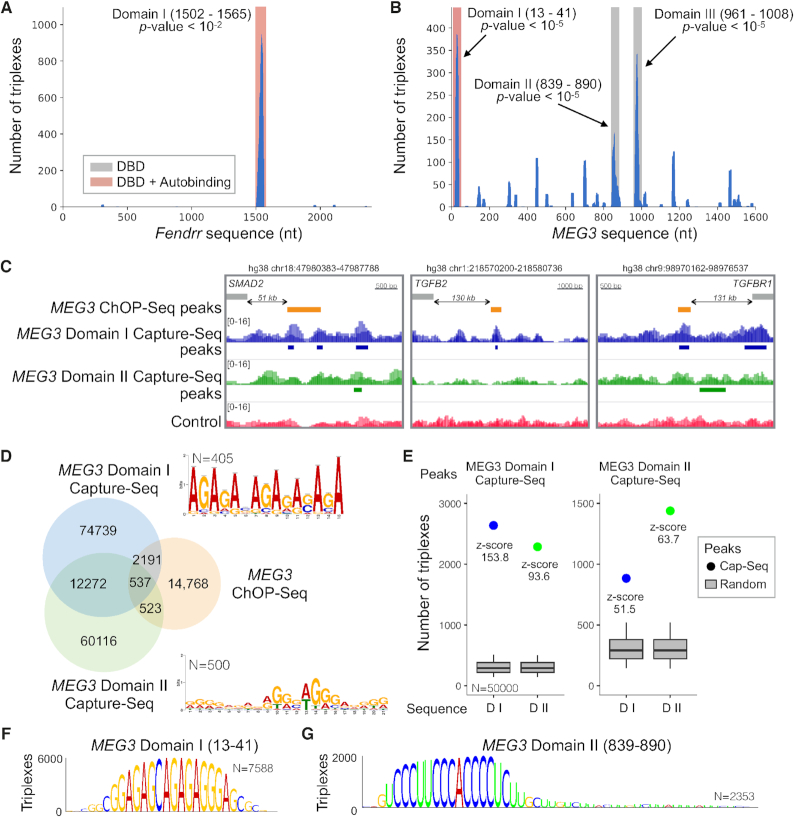
Figure 2.
TDF detects known and novel DNA binding domains of Fendrr and MEG3. (A, B) The coverage of TFOs (y-axis) within Fendrr and MEG3 sequences (x-axis). Regions highlighted in red/grey indicate significant DBDs. (C) DBD-Capture-Seq signals and peaks for Domain I (blue), Domain II (green), and control (red) as well as ChOP-Seq peaks in the validated triplex-forming regions (orange). (D) A Venn diagram showing the overlap between DBD-Capture-Seq (MEG3 Domains I and II) and MEG3 ChOP-Seq. De novo motifs detected in the top 500 DBD-Capture-Seq regions are also presented. (E) TDF analysis reveals a high propensity (higher z-score) of Domain I RNA to form triple helices in Domain I DBD-Capture-Seq peaks in comparison with Domain II RNA sequence and vice versa. (F, G) DBD logos indicating the nucleotides from the MEG3 domain sequence, which are predicted to form triple helices in Capture-Seq peaks of the respective domain. Higher nucleotides indicates higher number of triple helices (TTSs).

