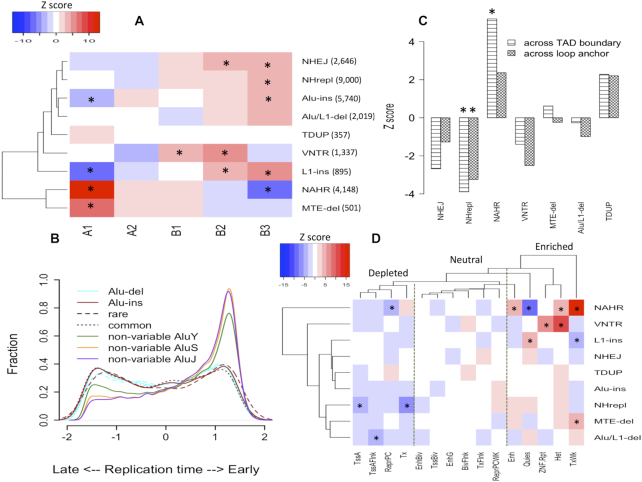
Figure 1.
Biased distribution of different SV classes. (A) Clustering of SV classes based on their enrichments by Z-score in 5 compartments, identified from Hi-C studies. Two major clusters can be observed. (B) Normalized distribution of replication timing for different Alus. Alu insertion and deletions were further classified as rare or common (minor allele frequency threshold, 1%). (C) Positive and negative Z-scores mean enrichment and depletion, respectively, of SVs across topologically associated domain (TAD) boundary or loop anchor. (D) Clustering of SV classes and functional states based on distribution of breakpoints in the states. The states were inferred from chromHMM segmentation of histone marks. Descriptions of each state are provided in supplementary Table S1. Dashed lines show three categories of states by enrichment with SV breakpoints. * represents adjusted P-value < 0.05 (Z-test with Bonferroni correction). Abbreviations: Variable number of tandem repeats (VNTR), Tandem duplications (TDUP), Deletions with multiple transposable elements (MTE-del).

