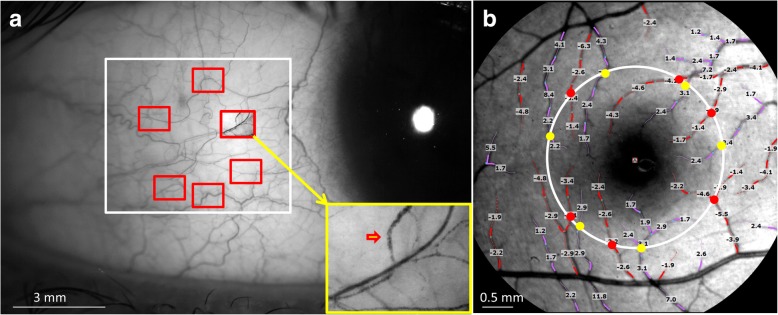
Fig. 1.
Blood flow velocity and blood flow rate of the conjunctiva and retina. FSLB and RFI were used to measure the blood flow velocity and flow rate in the conjunctiva (a) and retina (b). A total of six fields of view (red rectangles inside the white rectangle) were imaged using FSLB in the temporal side of the bulbar conjunctiva 1 mm apart from the limbus. With the extremely high magnification (~ 210 ×), the cluster of red blood cells was visualized (red arrowhead in the insert), which facilitated the measurement of blood flow velocity and flow rate. Retinal blood flow velocity was measured in the 2nd and 3rd branches of retinal arterioles (red) and venules (purple) which were overlaid with the measured blood flow velocity (note: negative values indicate arteriolar velocity). To estimate the blood flow in the retina, a circle (white, diameter = 2.5 mm) centered on the fovea was drawn. Vessel diameters of the vessels crossing the circle were measured in the arterioles (red dots) and venules (yellow dots). The velocity and vessel diameter were used to calculate the flow rate

