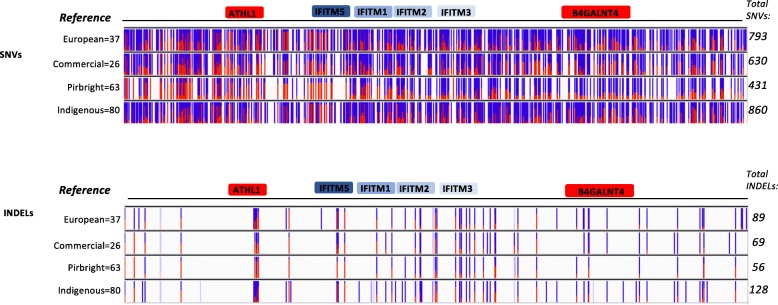
Fig. 1.
SNVs and INDELS frequency across the 40 kb region. The figure shows the overall distribution of the SNVs and INDELS across the 40 kb reference region. Blue and red bars length indicate the number of samples showing that particular SNVs or INDEL for that position (allele fraction for a single locus). Blue: reference allele, Red: alternate allele. Shaded blue or red indicate filtered entries for that locus in a fraction of the samples. Although many SNVs and INDELs occur cross the chIFITM genes, most of these are found in the non-coding regions (genes coding blocks shown). The total number of SNVs found within each group and the total number of samples analyzed per group are indicated (right and left). The PacBio consensus sequence was used as a reference (namely the 40 kb region encompassing the chIFITM locus, including the flanking genes)

