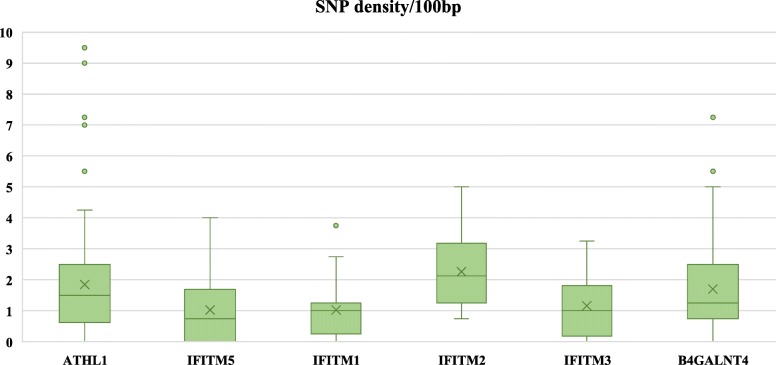
Fig. 3.
SNV density across the IFITM locus. Average number of SNVs per 100 bp in the chIFITM locus, including the flanking genes ATHL1 and B4GALNT4. The latter are 10 kb and 20 kb in length, thus showing more spread data compared to the smaller chIFITM genes. Nevertheless, chIFITM2 shows a higher degree of variability compared to the other IFITM genes

