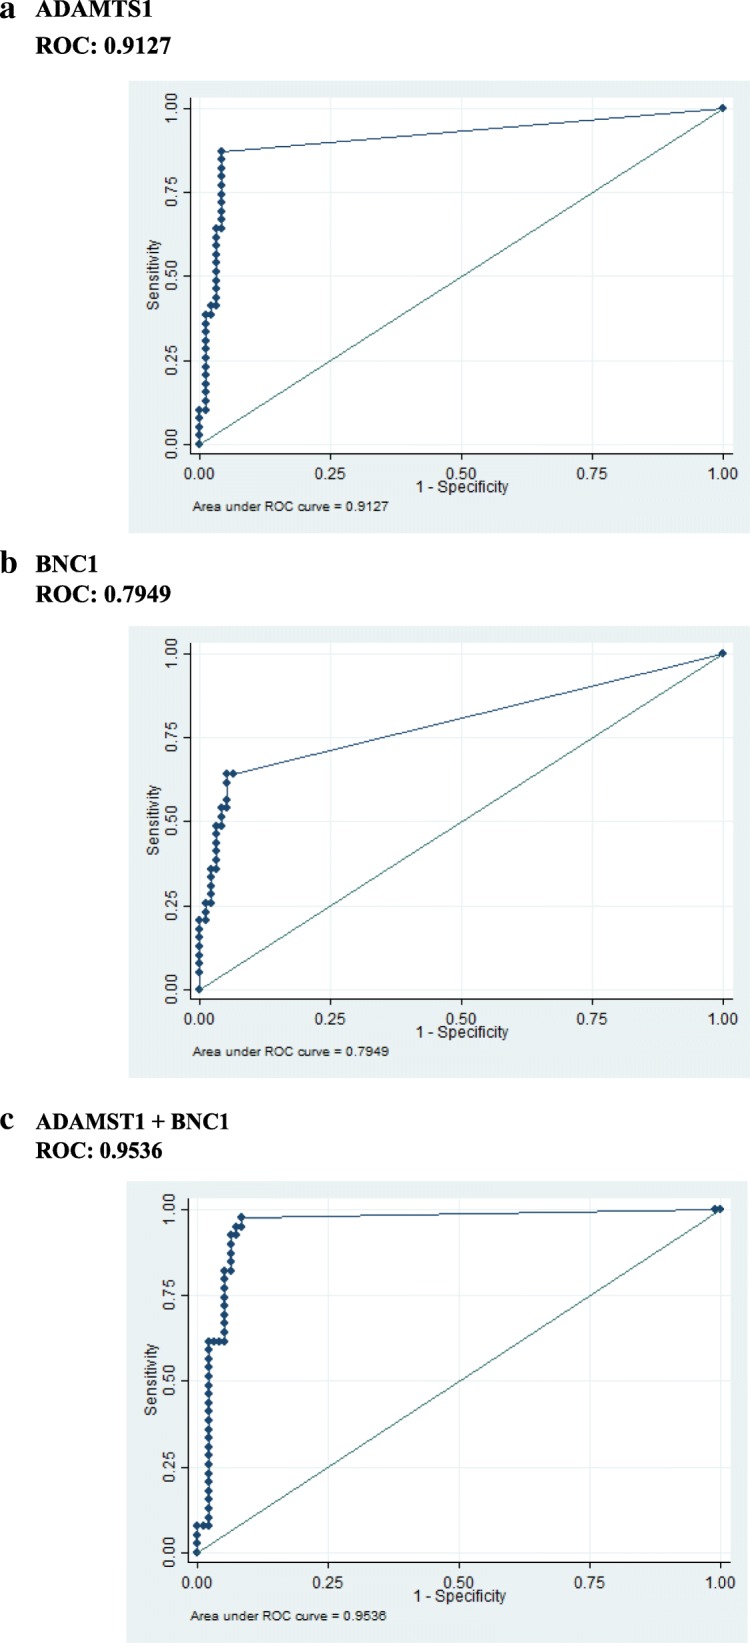
Fig. 2.

Sensitivity and specificity of both genes. ROC curves for various genes. (a, b) ROC curves are represented for individual genes (ADAMTS1 and BNC1) and c combined methylation status of the genes (ADAMTS1 + BNC1) from the plasma samples

Sensitivity and specificity of both genes. ROC curves for various genes. (a, b) ROC curves are represented for individual genes (ADAMTS1 and BNC1) and c combined methylation status of the genes (ADAMTS1 + BNC1) from the plasma samples