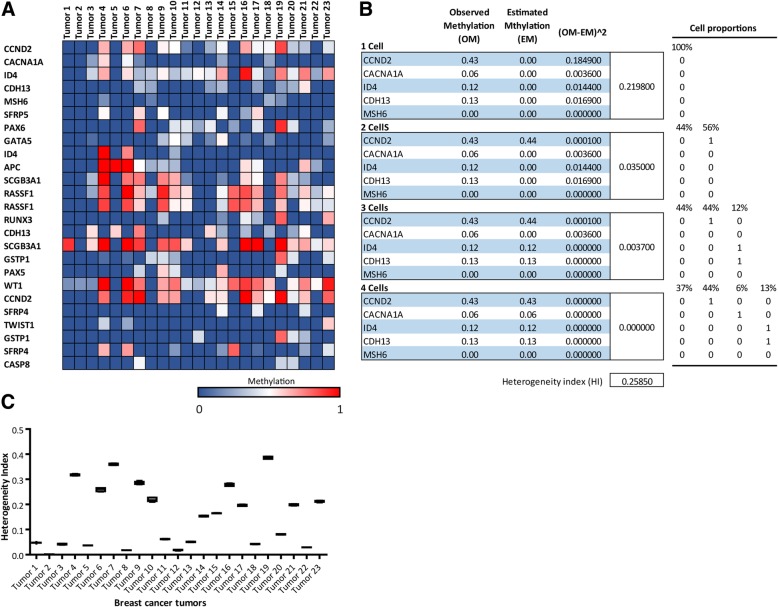
Fig. 1.
Heterogeneity index of breast carcinomas inferred from methylation profile obtained by MS-MLPA. a. Heat map showing the methylation status of 25 CpG sites (19 TSG) in rows on 23 breast tumors, represented in columns. A color gradient from blue-white-red is used to represent low to high values of methylation (from 0 to 1). b. Scheme showing the heterogeneity Index calculation using 1, 2, 3 and 4 cells inferred from methylation status of 5 CpG sites of tumor 7 (OM) showed in A. All the possible populations and all the possible cell proportions were tested in order to fit the observed values. The match between experimental and estimated methylation values (EM) was only seldom perfect. Considering the experimental error, we defined the sub-HI as the sum of the squared deviation between the experimental and estimated values (OM-EM)^2. The tumor final HI was set to the average of sub-HI after five randomized selections. c. HI calculated for the 23 breast tumors represented in box plot graph. The HIs are statistically different as assed by ANOVA with Tukey post hoc test p < 0.0001

