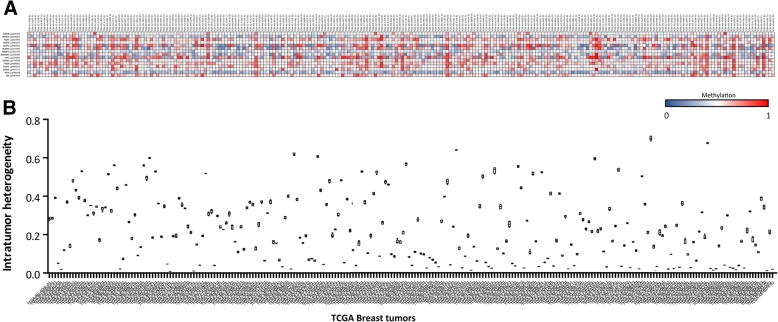
Fig. 5.
Heterogeneity index of 250 breast cancer tumors inferred from methylation profile obtained from TCGA dataset. a. Heat map showing the methylation status of 15 CpG sites (in rows) on 250 breast tumors (in columns). A color gradient from blue-white-red is used to represent low to high values of methylation (from 0 to 1). b. HI calculated for the 250 breast tumors represented in box plot graph

