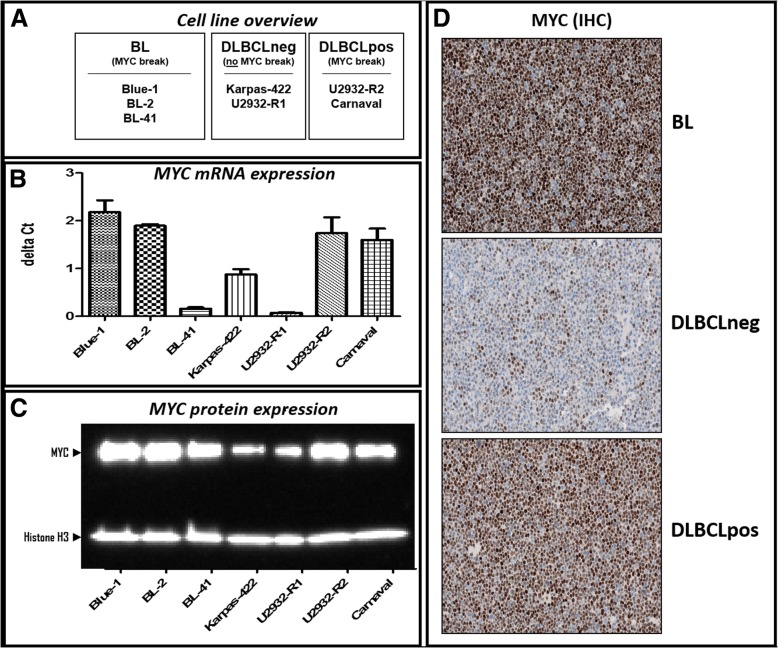
Fig. 1.
MYC expression in DLBCL and BL cell lines. a Cell lines categorized according to their genomic MYC status (MYC break). b Quantitative MYC RNA expression as determined by RT-PCR; endogenous control for normalization: B2M expression. c Western Blot analysis of MYC protein expression. d Immunohistochemical (IHC) staining for the cellular localization and distribution of MYC protein

