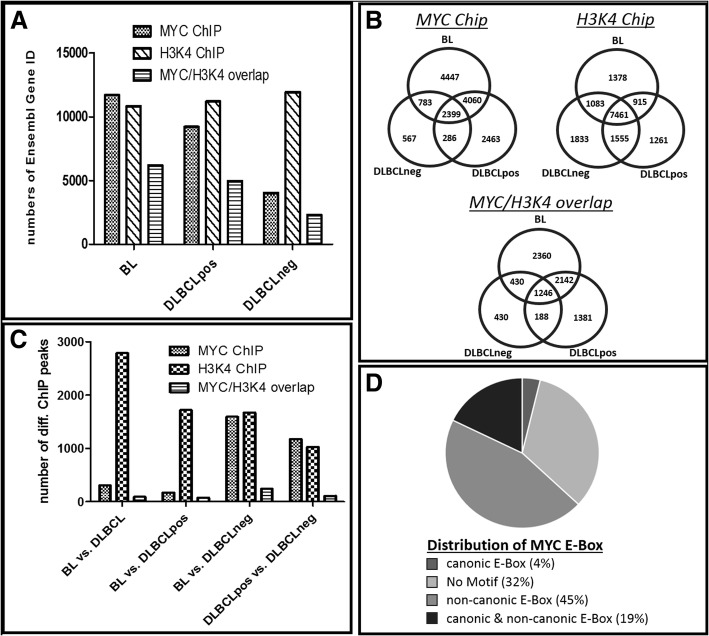
Fig. 2.
Differential binding patterns obtained by ChIP-Seq experiments. a Total gene counts identified by MYC-Chip, H3K4me3-ChIP, and an overlay of MYC/H3K4me3-ChIP peaks after MACS2 IDR peak calling. b Venn diagrams illustrate the number of identified targets after IDR peak calling of MYC and H3K4 ChIP, respectively, limited to within 2000 bp from Origin of Replication (ORI). Each count presents a single Ensembl gene ID. c Differential binding analysis between different lymphoma entities. Each count presents a single Ensembl gene ID, limitation by 2000 bp of ORI, IDR < 0.1 and p-value < 0.05. d Distribution of MYC E-Box binding motif within the identified genes with differential MYC-Chip peaks

