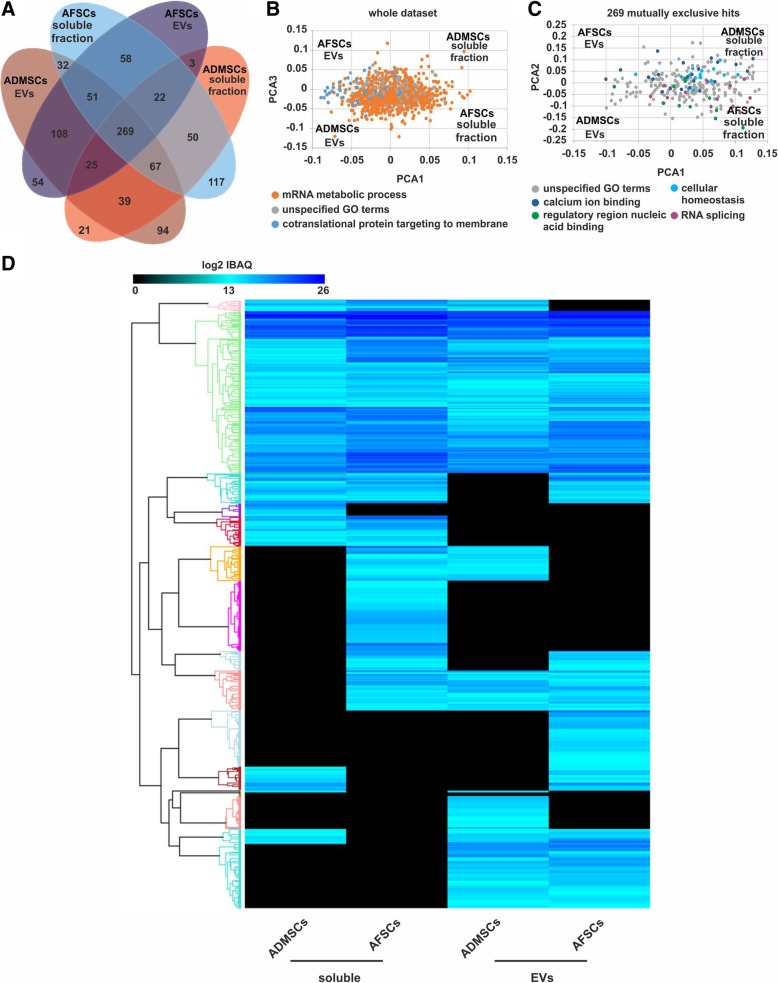
Fig. 6.
Comparative analysis of the proteins in soluble and EV fractions within the secretome of ADSCs and AFSCs revealed distinct profiles. a Numerical Venn diagram of identified hits. b PCA analysis using the entire dataset and c 269 proteins identified in all samples, highlighted in both b and c the most represented GO terms categories based on Benjamini-Hochberg FDR values. d Heat map reporting all identified hits and considering log2-transformed iBAQ quantification values

